Figure 4.
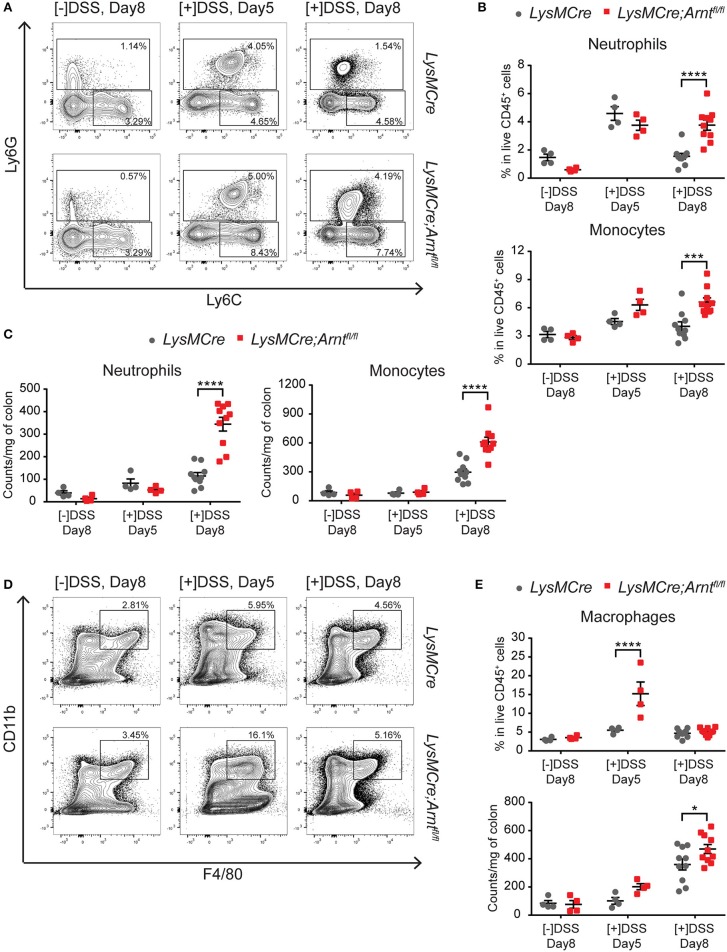
Characterization of myeloid cells in LysMCre and LysMCre;Arntfl/fl lamina propria. Following analyzes include untreated group ([–]DSS) sacrificed on day 8 (n = 4) and DSS-treated groups ([+]DSS) sacrificed on day 5 (n = 4) and day 8 (n = 10). (A) Representative gating of neutrophils (Ly6G+) and Ly6C+ monocytic cells (Ly6G−, Ly6C+) in live CD45+, CD11b+, CD11c− cells. (B) Percentages of neutrophils (top panel) and Ly6C+ monocytic cells (bottom panel) in live CD45+ cells. (C) Absolute counts normalized to colon weight of neutrophils (left panel) and Ly6C+ monocytic cells (right panel). (D) Representative gating of macrophages (CD11b+, F4/80+) in live CD45+cells. (E) Percentages in live CD45+ cells (top panel) and absolute counts normalized to colon weight (bottom panel) of macrophages in lamina propria. Data presented as mean ± s.e.m. Two-way ANOVA, *p < 0.05, ***p < 0.001, and ****p < 0.0001.

