Figure 6.
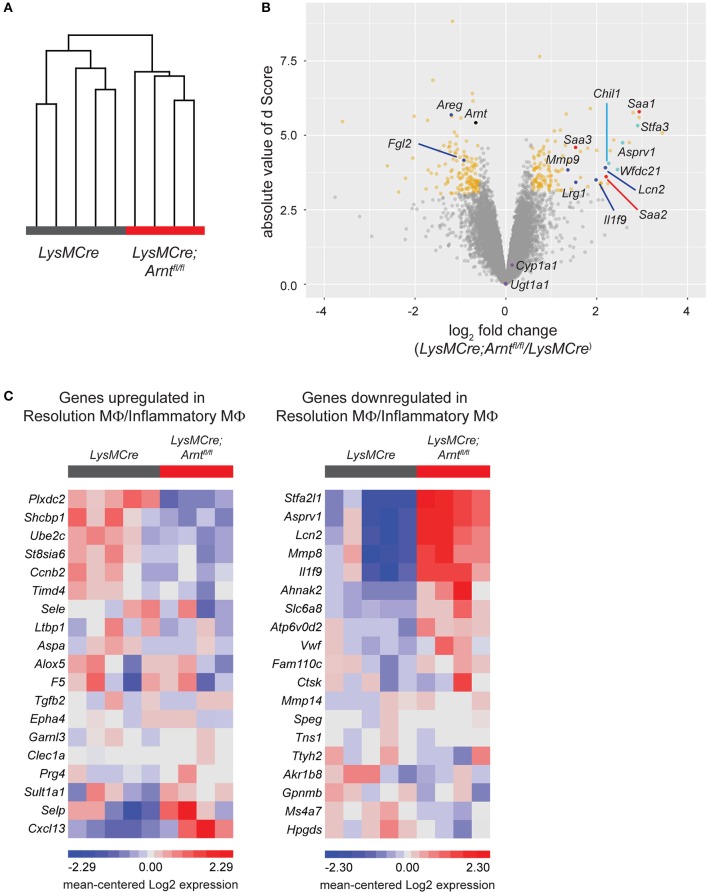
HIF deficiency renders macrophages less pro-resolving. (A) Unsupervised hierarchical clustering of microarray samples collected as sorted lamina propria macrophages from LysMCre and LysMCre;Arntfl/fl mice. Each sample was from a single mouse. Clustering was performed on log 2 normalized gene intensities (from robust multi-array average). Average linkage was used with Pearson dissimilarity as the distance measure. (B) Volcano plot of the statistical significance (d score, the T-statistic value used in Significance Analysis of Microarrays) against the log 2 ratio of gene expression between lamina propria macrophages from LysMCre and LysMCre;Arntfl/fl mice, based on the microarray analysis. The magnitude of d score scales with statistical significance. Genes with fold change below or above 1.5 and a false discovery rate (q-value) smaller than 5% are in yellow. (C) Heat maps of gene expression using the top 20 upregulated (left) and downregulated (right) genes in resolution phase macrophages (Gene Express, E-MEXP-3189). Gene expression data are from our microarray analysis of LysMCre;Arntfl/fl vs. LysMCre lamina propria macrophages. Each panel in (C) displays 19/20 genes differentially expressed (80), as one gene from each list was not detected in our microarray analysis.

