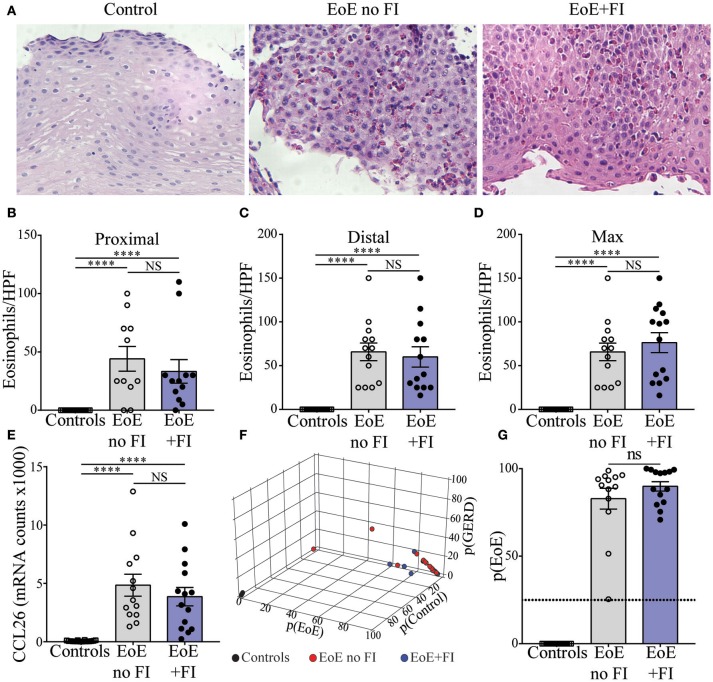
Figure 2.
Measures of EoE severity.(A) Representative hematoxylin and eosin staining of distal esophageal biopsies of Control, EoE no FI, and EoE+FI patients. Comparison of eosinophil counts in (B) proximal and (C) distal esophageal biopsies. (D) Maximum eosinophil infiltration. (E) CCL2 mRNA transcript levels in the esophagus. (F,G) disease probability scores (p(EoE), p(Control), p(GERD)) in Control, EoE no FI, and EoE+FI patients. ****p < 0.0001 as calculated by Dunn's multiple comparison test after Kruskal-Wallis test.

