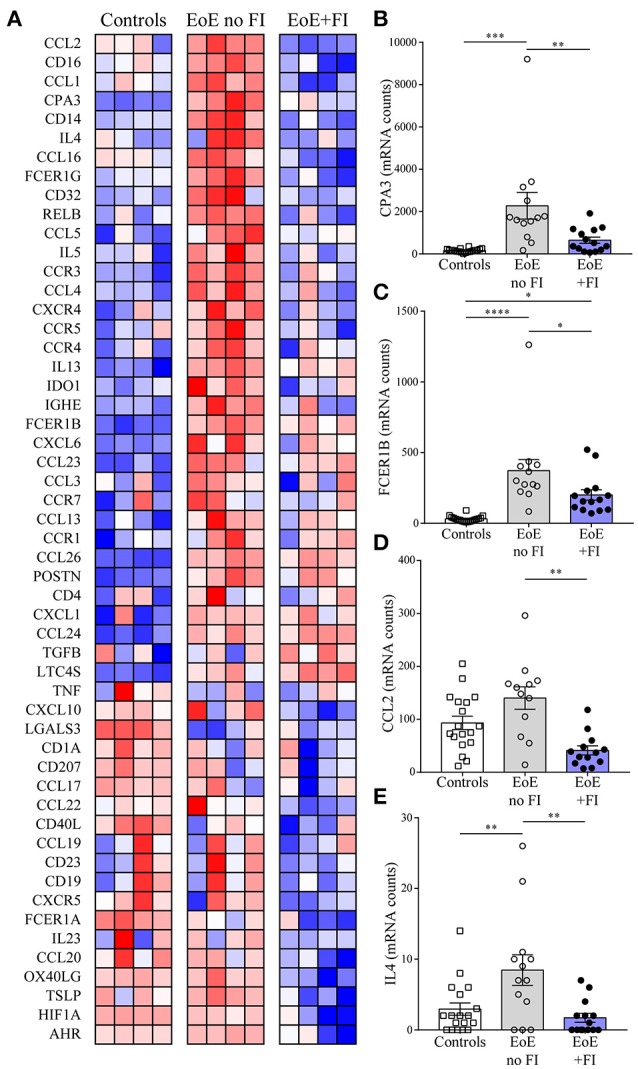
Figure 4.

EoE+FI specific mRNA pattern. (A) Heat map comparison of esophageal mRNA patterns in control, EoE no FI, and EoE+FI patients. Relative expression of (B) CPA3, (C) FCER1B, (D) CCL2, (E) IL4 in control, EoE no FI, and EoE+FI patients. *p < 0.05 **p < 0.01, ***p < 0.001,****p < 0.0001 as calculated by Dunn's multiple comparison test after Kruskal-Wallis test.
