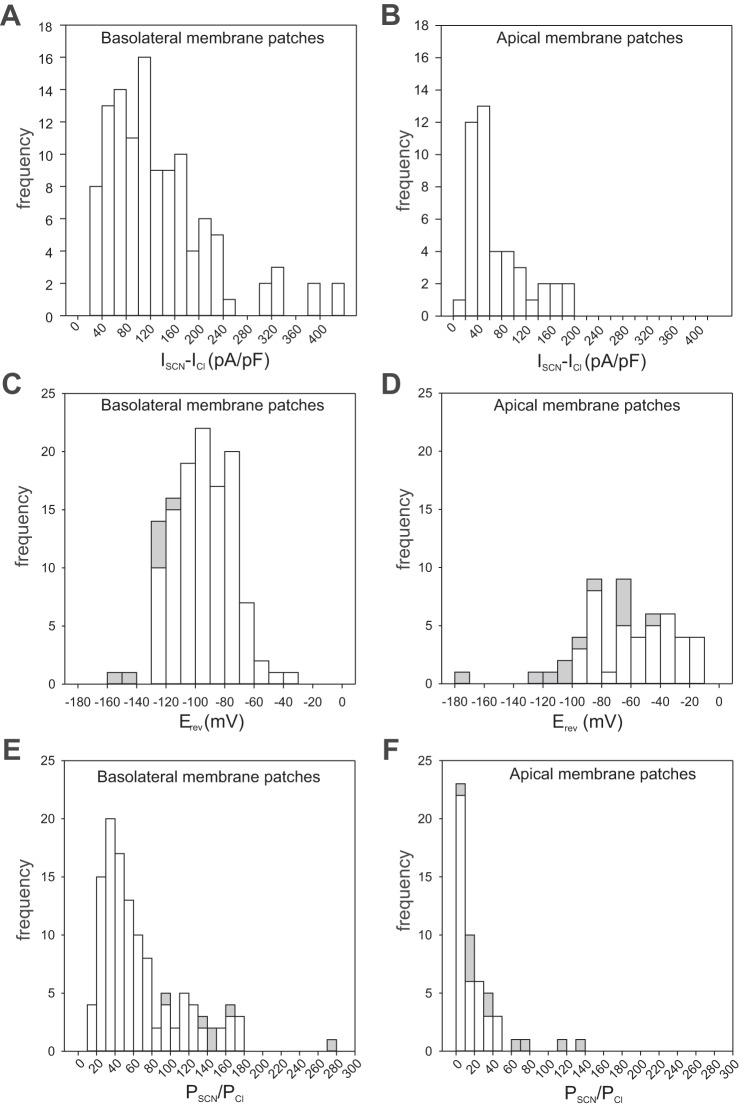
Fig. 10.
Basolateral and apical membrane patches differ in their selectivity for SCN−. Top: histograms showing the distribution of the change in current density at +60 mV produced by the replacement of 140 mM external Cl− with SCN− (ISCN – ICl) in outside-out patches of basolateral membrane (A) or apical membrane (B). Mean values of ISCN – ICl for basolateral membrane patches (115.5 ± 0.8 pA/pF; ± SE, n = 115) and apical membrane patches (50.2 ± 1.2 pA/pF; n = 43) were significantly different (P < E-6, Mann-Whitney U-test). The pipette solution contained 144 mM Cl−. Currents were normalized for membrane capacitance. Middle: distribution of reversal potentials (Erev) measured in outside-out patches of basolateral membrane (C) or apical membrane (D). Erev was determined from current-voltage (I-V) plots of currents generated by voltage ramps or steady-state currents evoked by voltage steps. Open bars represent data obtained from a holding potential of −60 mV and closed bars data from a holding potential of −120 mV. Mean values of Erev for basolateral membrane patches (−95.1 ± 1.9 mV; n = 121) and apical membrane patches (−63.5 ± 5.1 mV; n = 52) were significantly different (P < E-9, Mann-Whitney U-test). Data from two basolateral membrane patches and one apical membrane patch that were unresponsive to SCN are excluded from this analysis. Bottom: distribution of relative SCN− permeability (PSCN/PCl) values for outside-out patches of basolateral membrane (E) or apical membrane (F). Erev values were calculated from the data shown in C and D using the Goldman-Hodgkin-Katz equation. Not shown in the histograms are a PSCN/PCl value of 396 from one basolateral patch and a PSCN/PCl value of 869 from one apical patch. Mean values of PSCN/PCl for basolateral membrane patches (61.2 ± 5.1; n = 121) and apical membrane patches (37.4 ± 19.4; n = 52) were significantly different (P < E-10, Mann-Whitney U-test.

