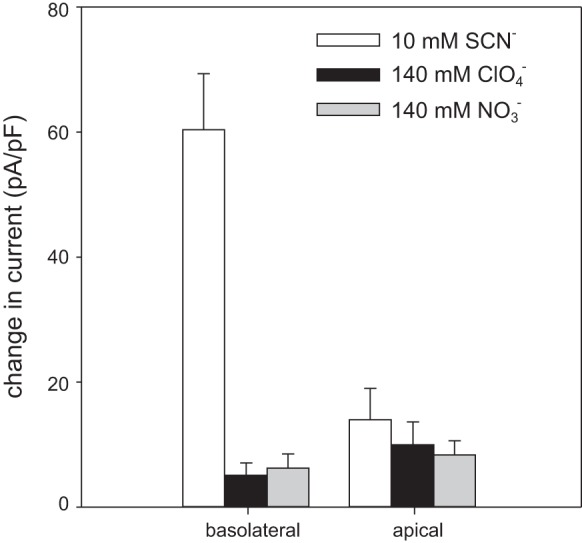
Fig. 11.

Basolateral and apical membrane patches differ in their response to 10 mM external SCN−. Vertical bars represent the mean change in current density at +60 mV produced by the replacement of 10 mM Cl− with SCN− (open bars) or the replacement of 140 mM Cl− with ClO4− (black bars) or (gray bars) in outside-out patches of basolateral (left) or apical membrane (right). The current density in 10 mM SCN− was significantly higher in basolateral membrane patches (75.0 ± 12.2 pA/pF, n = 8) than it was in apical membrane patches (21.1 ± 4.6 pA/pF, n = 8; P < 0.005). The was no significant difference in current density between basolateral membrane patches and apical membrane patches exposed to 140 mM external ClO4− or .
