Fig. 3.
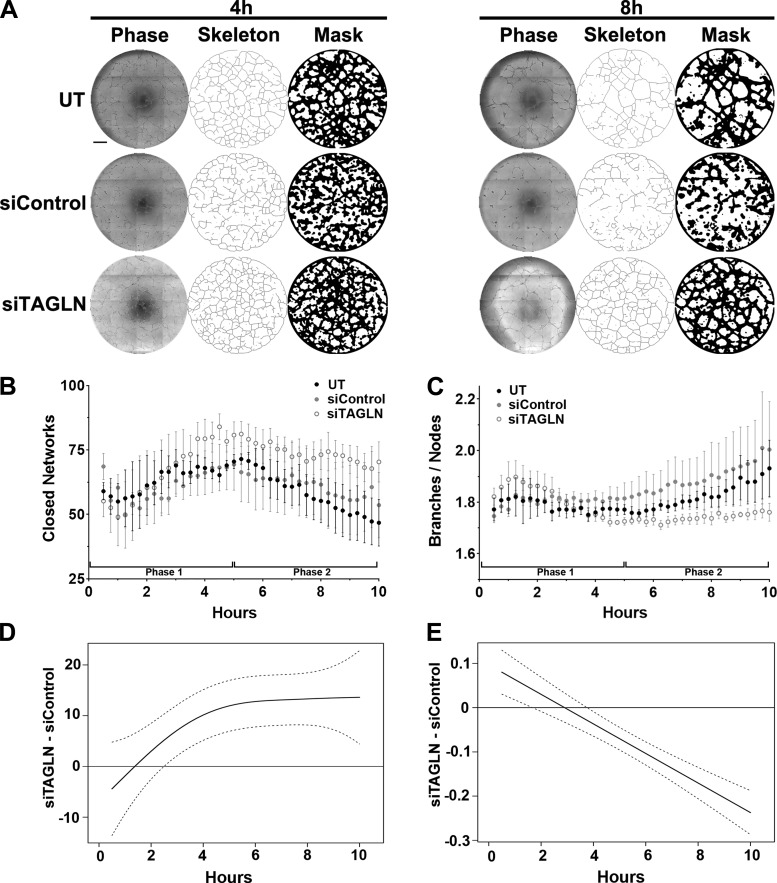
Kinetic analysis of vasculogenesis (KAV) identifies altered network formation kinetics following transgelin (TAGLN) knockdown. A: representative phase contrast (left), skeleton (middle), and mask (right) images of endothelial colony-forming cell (ECFC) network formation on Matrigel at 4 and 8 h postplating. ECFCs were obtained from gestational diabetes mellitus (GDM) pregnancies and were untreated (UT) or treated with nonspecific siRNA (siControl) or TAGLN-specific siRNA (siTAGLN). Scale bar, 500 µm. B and C: KAV software quantitated closed networks and the ratio of total branches divided by total nodes for UT (black), siControl (gray), and siTAGLN (white) samples. The data illustrated represent means ± SE of 5 individual transfections for each group. D and E: differences between the mean kinetic curves of the 2 experimental groups for each parameter are shown as solid black lines with the pointwise 95% confidence interval (CI) represented by dotted lines. A significant difference between the curves for a specific time point is detected if the CI of the difference curve does not cross the reference line (y = 0) at that time point.

