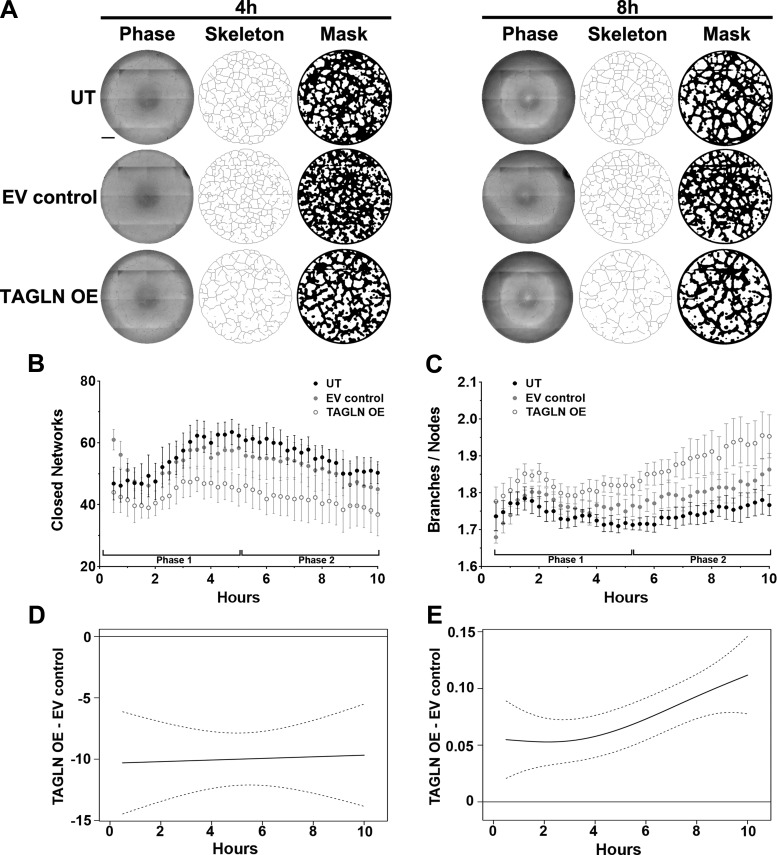
Fig. 6.
Kinetic analysis of vasculogenesis (KAV) identifies altered network formation kinetics following transgelin (TAGLN) overexpression. A: representative phase contrast, skeleton, and mask images of endothelial colony-forming cell (ECFC) network formation on Matrigel at 4 and 8 h postplating. ECFCs from uncomplicated pregnancies were transduced with TAGLN-containing lentivirus (TAGLN OE). Controls include untreated (UT) and a virus containing an empty vector (EV control). Scale bar, 500 µm. B and C: KAV software quantitated closed networks and the ratio of total branches divided by total nodes for UT control (black), EV control (gray), and TAGLN OE (white) samples. The data illustrated represent the means ± SE of 6 individual transductions for each group. D and E: differences between the mean kinetic curves of the 2 experimental groups for each parameter are shown as solid black lines with the pointwise 95% confidence interval (CI) represented by dotted lines. A significant difference between the curves for a specific time point is detected if the CI of the difference curve does not cross the reference line (y = 0) at that time point.

