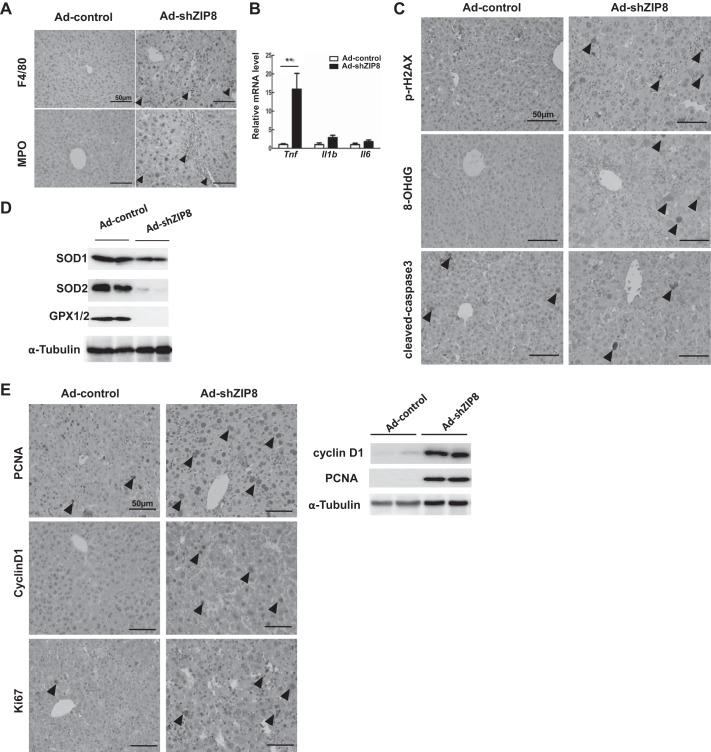
Fig. 4.
Hepatic inflammation, DNA damage, oxidative stress, and proliferation in Ad-shZip8 vs. Ad-control mice. A: representative immunohistochemistry (IHC) staining for F4/80 and myeloperoxidase (MPO) in Ad-shZip8 vs. Ad-control liver. B: relative mean expression of the proinflammatory cytokines Tnf, Il1β, and Il6 mRNA in Ad-shZip8 (n = 4 samples) vs. Ad-control (n = 4 samples) liver. C: relative amounts of IHC staining for γH2AX, 8-hydroxy-2′-deoxyguanosine (8-OHdG), and cleaved caspase 3 protein in Ad-shZip8 vs. Ad-control liver. D: expression of SOD1, SOD2, glutathione peroxidase (GPX)1 and GPX2 in Ad-shZip8 vs. Ad-control liver, as determined by Western blot and normalized with α-tubulin. E: IHC staining for proliferating cell nuclear antigen (PCNA), Cyclin D1, and cleaved Ki67 proteins in Ad-shZip8 vs. Ad-control liver (left). Expression of Cyclin D1 and PCNA in Ad-shZip8 and Ad-control liver, as detected by Western blot and normalized with α-tubulin. Arrowheads represent IHC-positive staining. Scale bar: 50 μm. Bar graphs represent means ± SE, with mean expression in controls set to 1.0. *P ≤ 0.05 by Student’s t-test.

