Fig. 3.

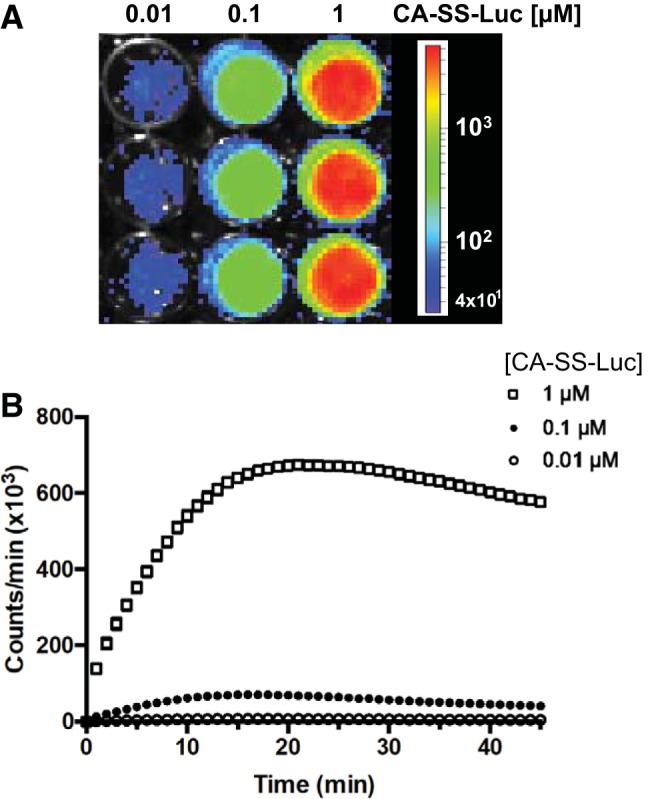
The bioluminescence generated by CA-SS-Luc in 2BT cells is concentration and time dependent. 2BT cells treated with increasing concentrations of CA-SS-Luc were imaged using an in vivo imaging system (IVIS). A: a representative IVIS image following 20-min incubation. B: time course of luminescence production by 0.01 (○), 0.1 (●), and 1 μM (□) of CA-SS-Luc; n = 3. Error bars representing SE are displayed but are too small to be seen for most points. Two-way ANOVA: time (P < 0.0001) and dose (P < 0.0001).
