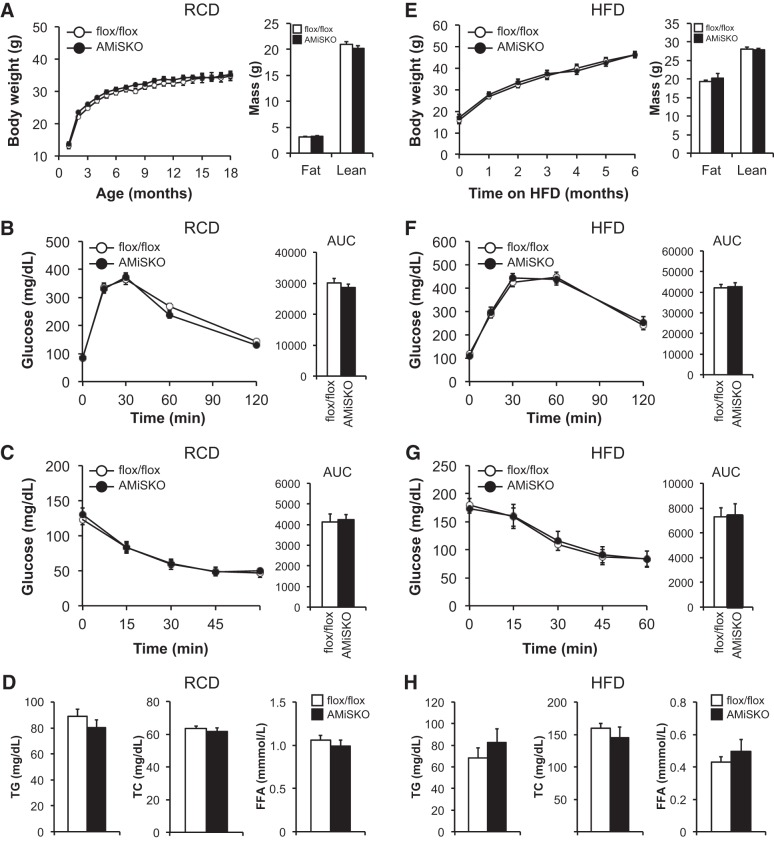
Fig. 3.
Metabolic phenotype of AMiSKO mice under RCD and HFD conditions. Characterization of male AMiSKO and flox/flox mice fed either a RCD (A–D) or HFD (E–H). For HFD study, mice were placed on a HFD starting from 3 to 7 wk of age. Body weight and body composition were measured in 3- to 6-mo-old RCD-fed mice (A) and in mice after 6 mo of HFD feeding (E) (n = 5–9 per group). Blood glucose concentrations during the intraperitoneal glucose tolerance tests (IPGTTs) in 9- to 12-mo-old RCD-fed mice (B) and in mice after 4 mo of HFD feeding (F) (n = 9–10 per group). Area under the curve (AUC) for glucose is shown next to each curve. Blood glucose concentrations during insulin tolerance tests (ITTs) in 9- to 12-mo-old RCD-fed mice (C) and in mice after 4 mo of HFD feeding (G) (n = 9–10 per group). AUC for glucose is shown next to each curve. Plasma concentrations of triglyceride (TG), total cholesterol (TC), and free fatty acids (FFA) were determined in 9- to 12-mo-old RCD- fed mice (D) and in mice after 6 mo of HFD feeding (H) (n = 5–10 per group). There was a significant time effect (P < 0.05) but no group × time interaction in body weight, IPGTT, and ITT data (ANOVA). Values are means ± SE.

