
Fig. 3.
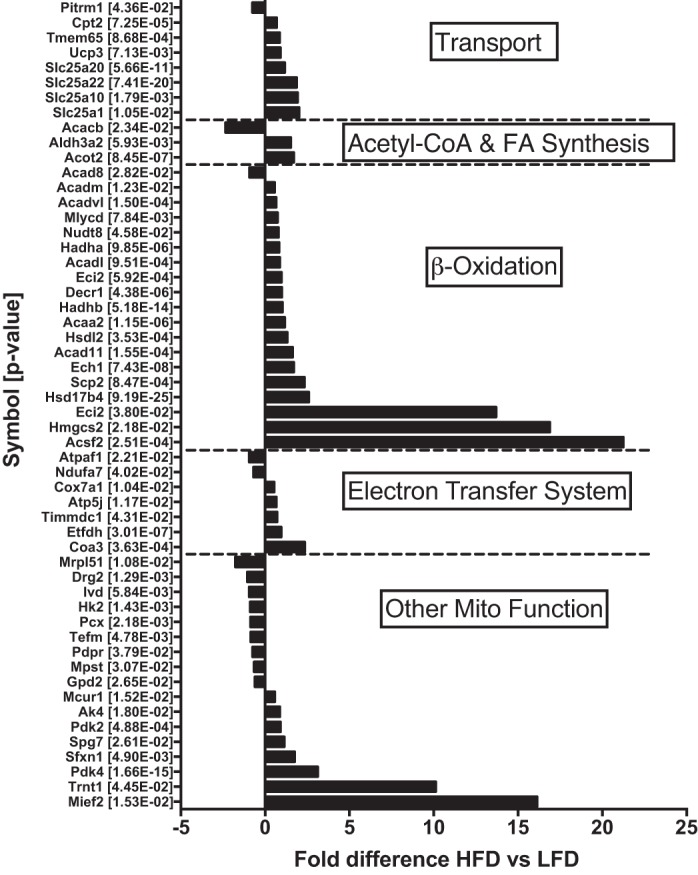
Individual mitochondrial proteins with fold difference ≥0.5 and P ≤ 0.05 were grouped according to function and are displayed as fold difference between mice consuming the low-fat diet (LFD) and mice consuming the high-fat diet (HFD). Proteins are displayed with gene symbol and exact P value for unpaired t-test of fold difference between diet groups (n = 8 per diet group). FA, fatty acid; Mito, mitochondrial.