
Fig. 4.
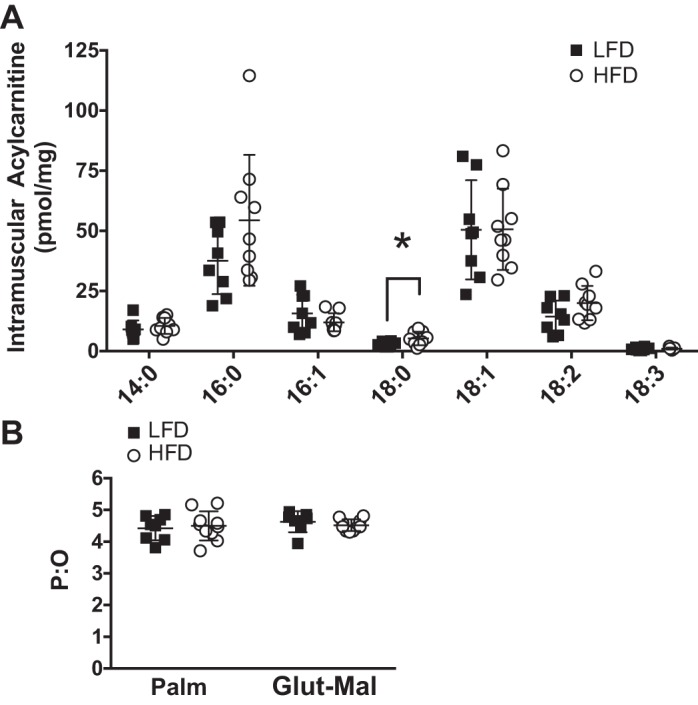
A: skeletal muscle acylcarnitines identified by liquid chromatography paired with mass spectrometry and classified based on saturation and chain length. B: mitochondrial phosphorylation efficiency [ratio of ATP production to O2 consumption (P:O)] of mice consuming the low-fat diet (LFD) and mice consuming the high-fat diet (HFD) for 12 wk determined by a subsaturating pulse of ADP during high-resolution respirometry using substrates of palmitoylcarnitine (Palm) and glutamate-malate (Glu-Mal). Bars represent mean (SD) (n = 8 per diet group). *P ≤ 0.05, LFD vs. HFD (by unpaired t-test).