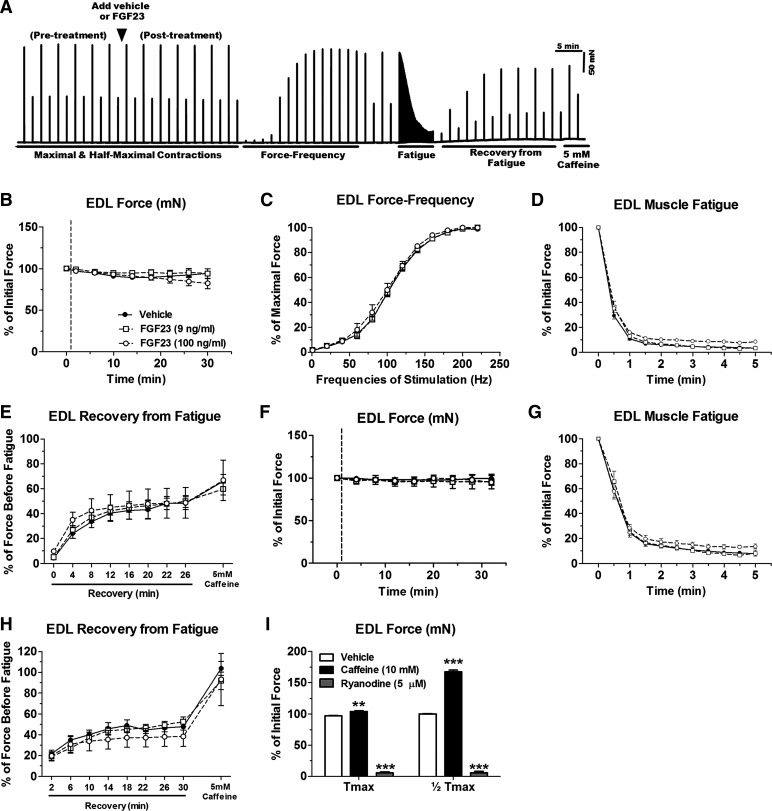
Fig. 6.
Acute FGF23 administration does not alter CD-1 mouse EDL muscle contractile properties. A: representative ex vivo contractility force data obtained from 1 muscle (x-axis: time; y-axis: force) showing an entire contraction protocol and time of FGF23 addition. B: maximal tetanic force output (at 200-Hz stimulation) from CD-1 mouse EDL muscles after treatment with vehicle or FGF23 expressed relative to values before vehicle or FGF23 application. C: force-frequency relationship of vehicle- or FGF23-treated EDL muscles stimulated to contract with frequencies in the range of 1–220 Hz. Forces at each frequency are expressed relative to the maximal force obtained. D: time course of maximal tetanic force decline during a fatiguing protocol in vehicle- or FGF23-treated EDL muscles. Force at each time point is expressed relative to force just before fatigue. E: maximal tetanic force recovery during various time points postfatigue and with the addition of 5 mM caffeine in vehicle- or FGF23-treated EDL muscles. F: half-maximal tetanic force output (at 100-Hz stimulation) from CD-1 mouse EDL muscles after treatment with vehicle or FGF23 expressed relative to values before vehicle or FGF23 application. G: time course of half-maximal tetanic force decline during a fatiguing protocol in vehicle- or FGF23-treated EDL muscles. Force at each time point is expressed relative to force just before fatigue. H: half-maximal tetanic force recovery during various time points postfatigue and with the addition of 5 mM caffeine in vehicle- or FGF23-treated EDL muscles. I: maximal and half-maximal tetanic force after exposure of EDL muscles to 10 mM caffeine or 5 µM ryanodine, as positive controls, expressed as %force before vehicle or FGF23 treatment (however, error bars that are present in each group may be too small to be seen). Dashed lines in B and F represent points at which FGF23 was added to the muscle contractility bath; n = 3–10 muscles/group. **P < 0.01 and ***P < 0.001, 2-way ANOVA with Bonferroni post hoc analysis.

