Fig. 3.
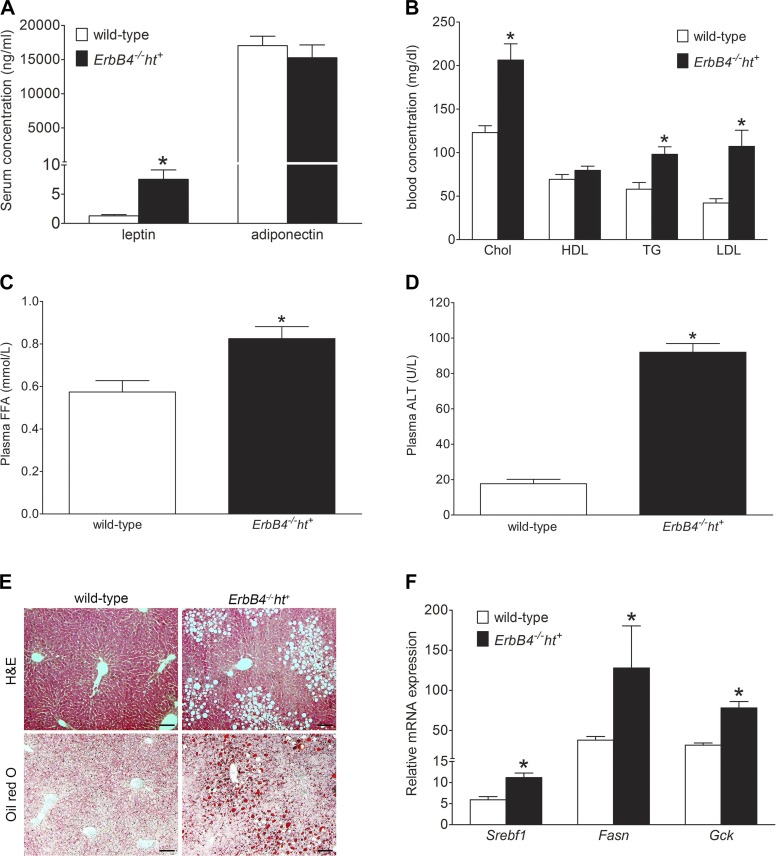
Mice with ErbB4 deletion developed dyslipidemia and hepatic steatosis. A: serum leptin and adiponectin levels in ErbB4 deletion and wild-type mice fed the medium-fat diet for 24 wk. B: blood lipid profile indicating levels of cholesterol (Chol), high-density lipoprotein cholesterol (HDL), triglyceride (TG), and low-density lipoprotein cholesterol (LDL). C: plasma free fatty acid (FFA) levels. D: plasma alanine aminotransferase (ALT) levels. Values are means ± SE (n = 9–10 in each group). *P < 0.01 vs. wild-type. E: representative hematoxylin-eosin- and oil red O-stained sections of liver from wild-type and ErbB4 deletion mice. Scale bars = 100 µm. F: relative hepatic lipogenic gene [sterol regulatory element-binding transcription factor 1 (Srebf1), fatty acid synthase (Fasn), and glucokinase (Gck)] expression levels from real-time PCR assay. Values are means ± SE (n = 6 in each group). *P < 0.05 vs. wild-type.

