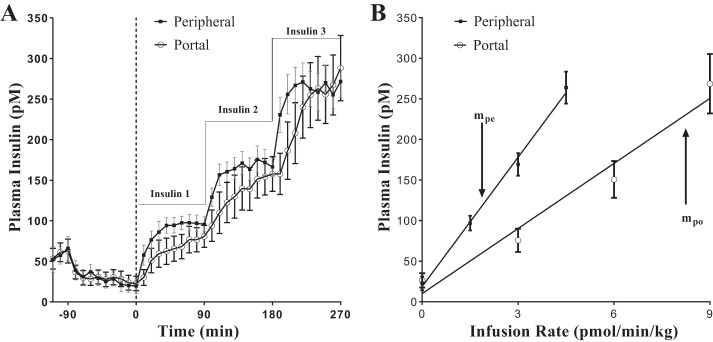
Fig. 3.
Paired portal/peripheral insulin infusion (PPII) clamp for measuring first-pass hepatic insulin extraction. A: insulin profile during the PPII experiments. For portal infusion protocol (○), Insulin 1 = 3.0 pmol·kg−1·min−1, Insulin 2 = 6.0 pmol·kg−1·min−1, and Insulin 3 = 9.0 pmol·kg−1·min−1. For peripheral infusion protocol (■), Insulin 1 = 1.5 pmol·kg−1·min−1, Insulin 2 = 3.0 pmol·kg−1·min−1, and Insulin 3 = 4.5 pmol·kg−1·min−1. One-half the portal infusion rates were used in the peripheral protocol for matching systemic concentrations. B: infusion rate vs. steady-state plasma insulin concentration. Correlation coefficient r for peripheral infusion vs. steady-state concentration (■) was 0.99, and slope, mpe, was 53.1 kg·min−1·l−1. For portal infusion vs. steady-state concentration (○), r = 0.98 and slope, mpo, was 26.7 kg·min−1·l−1. FPE (%) = [1 − (mpo/mpe)] × 100 = 50%; refer to Eq. 6. Each data point is a mean ± SE of n = 9.

