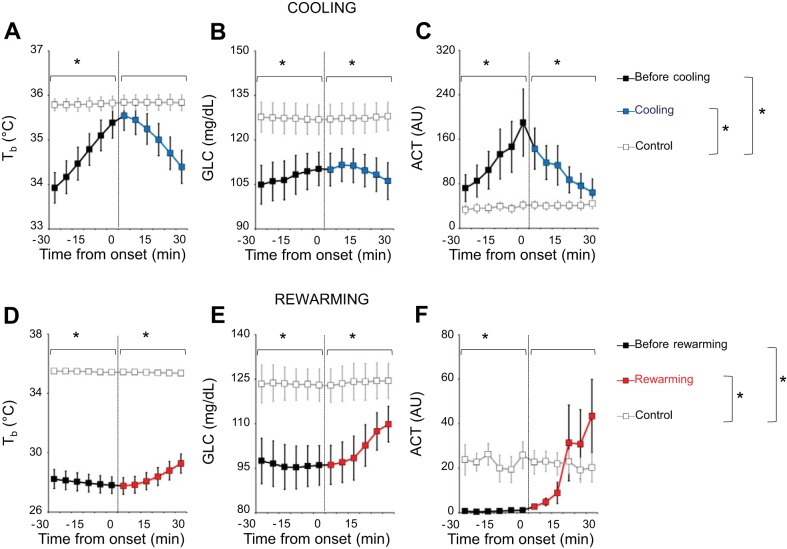
Fig. 5.
Blood glucose, core body temperature, and activity before/after the onset of cooling and rewarming periods. A–C: comparison of core body temperature (Tb), blood glucose concentration (GLC), and activity [ACT; in arbitrary units (AU) per 1-min recording], averaged over 5-min intervals, between cooling periods (black lines before cooling onset, blue lines after cooling onset) and temporally matched periods of stable euthermia (control periods, gray lines). D–F: comparison the same variables between rewarming periods (black lines before rewarming onset, red lines after rewarming onset) and temporally matched periods of stable euthermia (control periods, gray lines). Time 0 indicates the onset of the cooling/rewarming periods. Data are reported as means ± SE; n = 6. *P < 0.05, cooling or rewarming vs. control periods (t-test).

