Fig. 6.
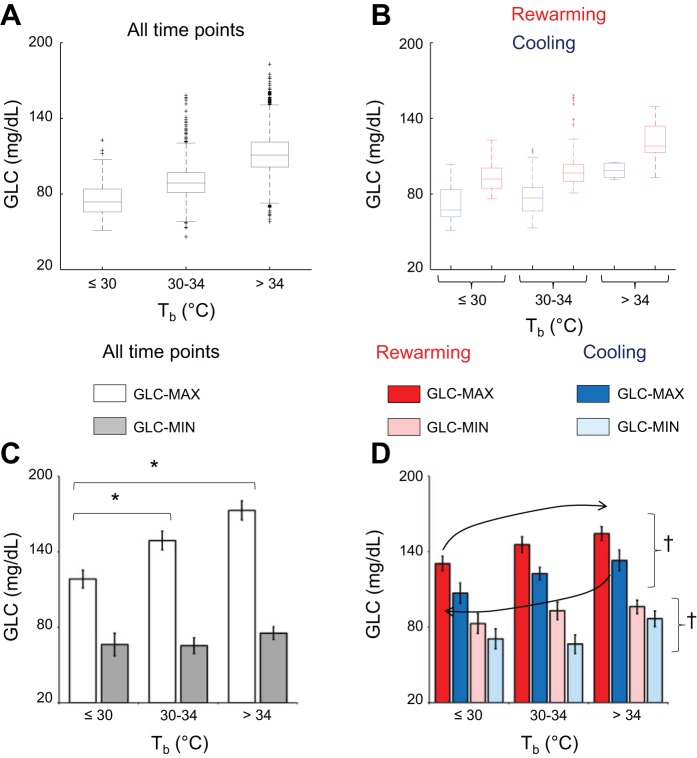
The relationship between blood glucose and core body temperature during periods of body cooling and rewarming. A and B: boxplots of the distribution of blood glucose concentration (GLC) values (averages over 5-min intervals) in 1 representative mouse throughout the whole recording period at 23°C, including all time points (A) or only the cooling (blue) and rewarming (red) periods (B; cf. materials and methods for details), as a function of core body temperature (Tb; ≤30°C, 30–34°C, >34°C). Boxplot whiskers were taken as estimates of the maximum and minimum values of GLC robust to the effect of extreme values in the distribution (MAX and MIN, respectively). C and D: means ± SE (n = 6 mice) of MAX and MIN of GLC on all time points (C) or only for cooling (blue) and rewarming (red) periods (D) as a function of Tb (≤30°C, 30–34°C, >34°C). The black arrows in panel D highlight the hysteresis in the relationship between GLC and Tb during cooling and rewarming periods. *P < 0.05, for values at 30–34°C Tb vs. values at ≤30°C or >34°C Tb (t-test). †P < 0.05, cooling vs. rewarming periods irrespective of Tb (ANOVA main effect).

