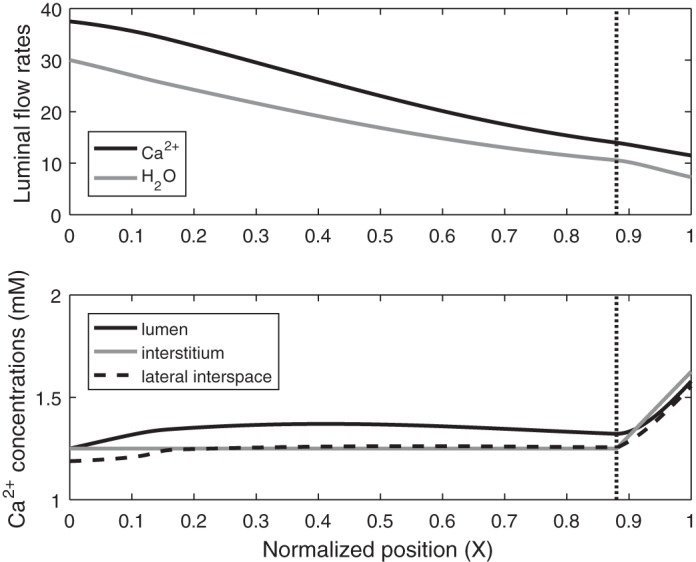
Fig. 2.

Base-case Ca2+ flows and concentrations along the proximal tubule. Top: molar flow rate of Ca2+ (in pmol/min per nephron) and H2O (in nl/min per nephron) in the lumen as a function of normalized position X (i.e., position divided by proximal tubule length). Bottom: Ca2+ concentration in lumen, interstitium, and lateral interspace as a function of X. Vertical line denotes the boundary between the cortex and the medulla, which marks the transition between the S2 and S3 segments.
