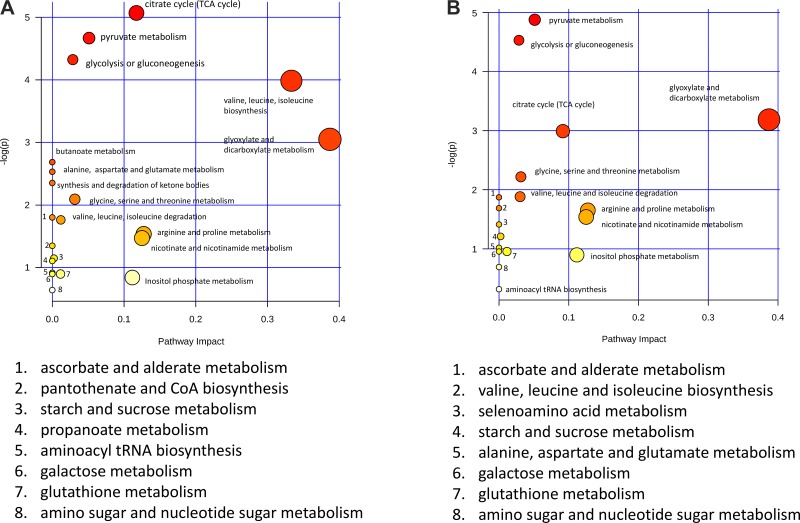
Fig. 4.
Pathway analysis based on metabolic profiling comparisons at 24 and 48 h posthypoxia. A: MetaboAnalyst pathway analysis for the 24-h sample comparison calculated using the 30 metabolites identified from the nuclear magnetic resonance spectroscopy (NMR)-based metabolic profiling analysis. The metabolic pathways are either labeled in the plot or indicated on bottom. The pathway significance (y-axis) is based on the pathway enrichment algorithm and is indicated by intensity of the color shading, and the pathway impact (x-axis) is determined by pathway topology analysis and is indicated by the diameter of the circle representing the pathway. TCA, tricarboxylic acid. B: MetaboAnalyst pathway analysis for the 48-h sample comparison calculated using the 28 metabolites identified from the nuclear magnetic resonance spectroscopy (NMR)-based metabolic profiling analysis.

