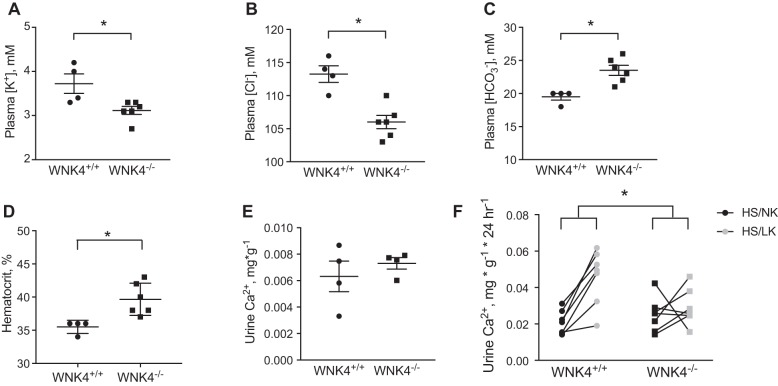
Fig. 1.
Plasma and urine electrolytes and hematocrit in control (wnk4+/+) and knockout (wnk4−/−) mice. A: plasma [K+]. B: plasma [Cl−]. C: plasma []. D: hematocrit. E: urine calcium excretion. F: effects of diet on urine calcium excretion. Black symbols indicate high-salt/normal-K+ diet (HS/NK), and gray symbols indicate high-salt/low-K+ diet (HS/LK). A–E: effects compared with Mann-Whitney U-test. *P < 0.05. For F, 2-way analysis of variance was performed.

