Fig. 2.
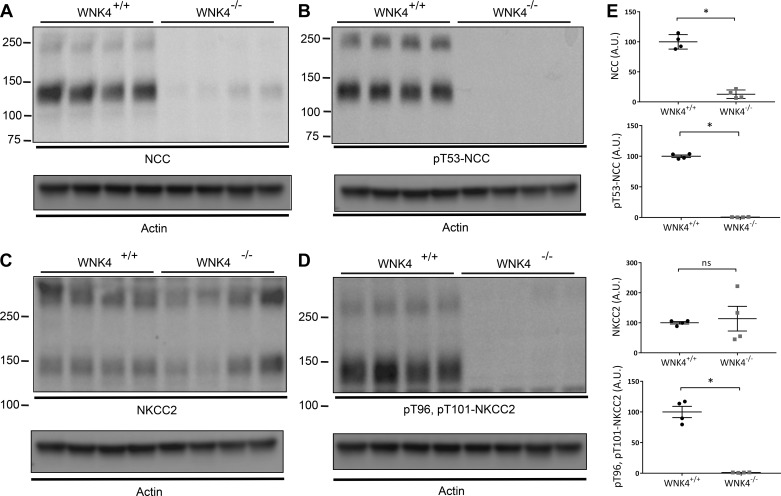
Abundance of NCC and NKCC2 in control and wnk4−/− mice. A: abundance of total NCC. B: abundance of phosphorylated NCC (pT53-NCC). C: abundance of total NKCC2. D: abundance of phosphorylated NKCC2 (pT96, pT101-NKCC2). In each case, presumed monomers and multimeric forms are shown. Actin loading controls are shown for each blot. E: abundances of NCC, pT53-NCC, and pT96, pT101-NKCC2 were highly significantly different between controls and wnk4−/−. *P < 0.001. In the case of NKCC2, there were no significant differences. Note that this anti-phospho-NKCC2 antibody is not specific, as suggested by the overlapping apparent molecular weight of the band in D (compare with B and C). Densitometric quantitation to actin was performed using ImageJ.

