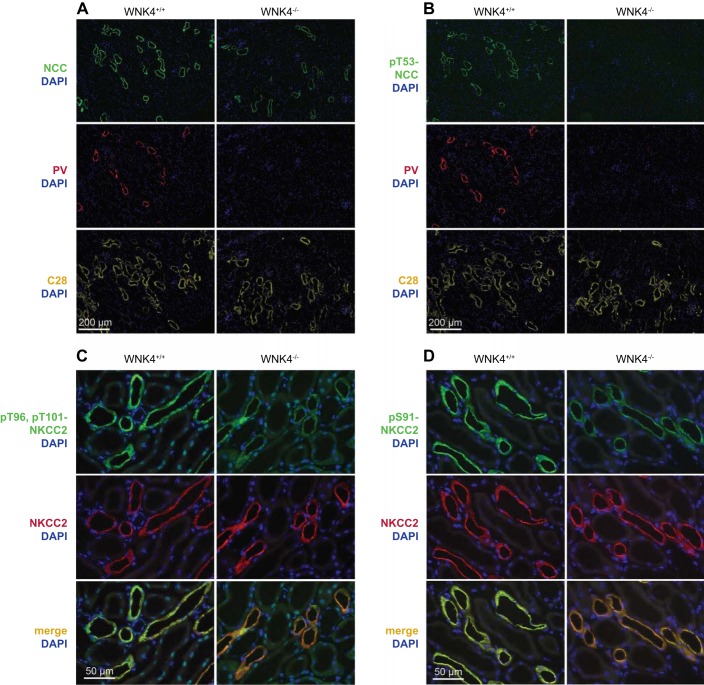
Fig. 4.
Localization and abundance of total and phosphorylated transporters in control and wnk4−/− mice. A: abundance and localization of NCC in control and wnk4−/− mice. Parvalbumin (PV) is expressed along the DCT1. Calbindin (C28) is expressed along the DCT2 and CNT. DAPI is a nuclear marker. B: abundance and localization of pT53-NCC in control and wnk4−/− mice. C: abundance and localization of NKCC2 and pT96, pT101-NKCC2 in control and wnk4−/− mice. Note that only pT96, pT101-NKCC2 is substantially reduced by WNK4 knockout and that total NKCC2 abundance appears unchanged. D: abundance and localization of NKCC2 and pS91-NKCC2 in control and wnk4−/− mice. Note that again, only pS91-NKCC2 is reduced by WNK4 knockout.

