Fig. 4.
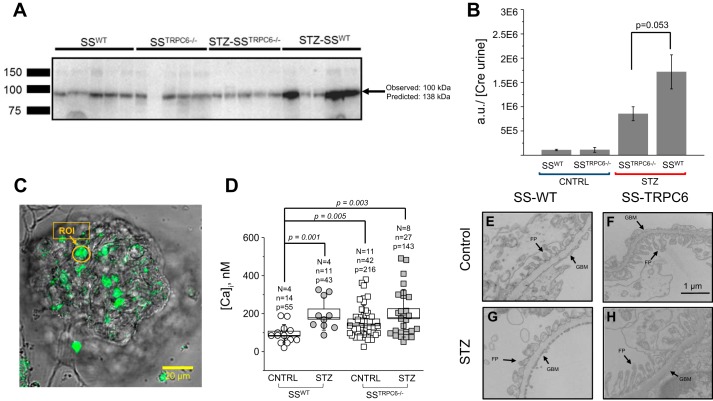
Assessment of podocyte damage. A: Western blot analysis of urinary nephrin levels. B: quantification of Western blot shown in A. Urine samples collected at the end of experiments (day 76) were used in Western blot analysis for nephrin shedding in all experimental groups. Each line represents one rat. Arrow indicates nephrin band and weight. C: representative image of confocal fluorescent microscopy. Region of interest (ROI) and arrow indicating an example of podocyte used for analysis. D: box plot summarizing the concentration of intracellular calcium ([Ca2+]i) comparing SSWT versus STZ-SSWT versus SSTrpc6−/− versus STZ-SSTrpc6−/−. N = no. of rats, n = no. of glomeruli, P = no. of podocytes. E–H: representative electron microscopy images of freshly isolated glomeruli. Foot process (FP) and glomerular basement membrane (GBM) are shown. STZ-SSTrpc6−/− have a blunting in FP damage in comparison to STZ-SSWT. n = 3 for SSTrpc6−/− and STZ-SSTrpc6−/− and n = 2 for SSWT and STZ-SSWT. SS, salt-sensitive; STZ, streptozotocin; WT, wild type.

