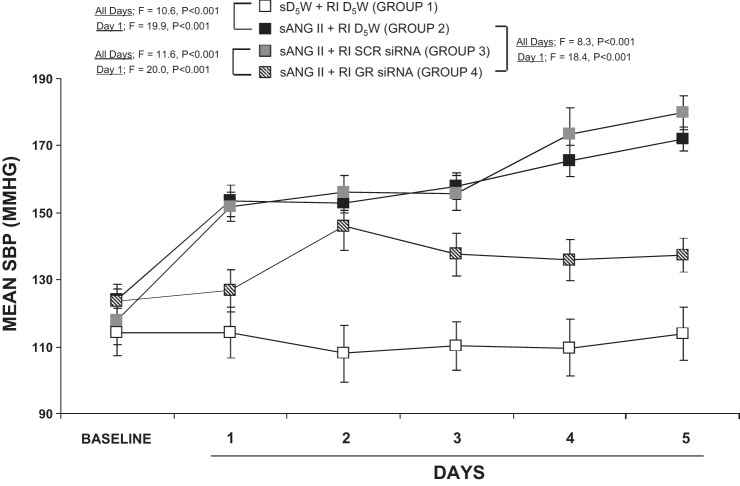
Fig. 3.
Mean systolic blood pressure (SBP) response to systemic 5% dextrose in water (sD5W) + renal interstitial (RI) D5W (open square, group 1), sANG II + RI D5W (solid square, group 2), sANG II + RI scrambled (SCR) siRNA (shaded square, group 3), and sANG II + RI ghrelin receptor (GR) siRNA (striped square, group 4) infusions. Results are reported as mmHg. Data represent means ± SE.

