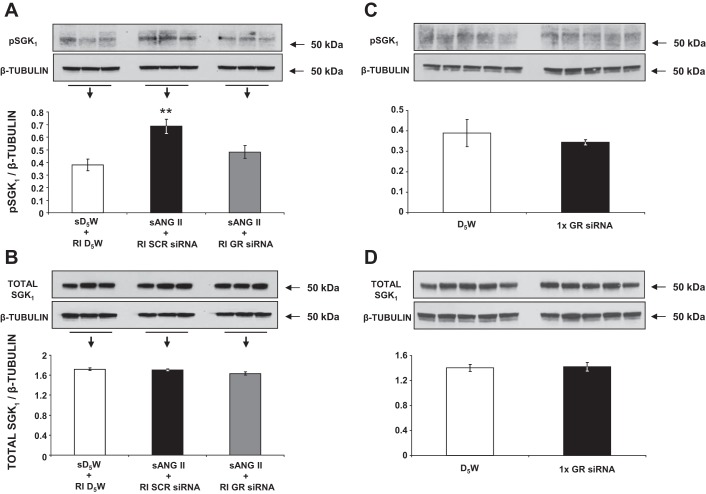
Fig. 9.
A: Western blot analysis of kidney phosphorylated serum and glucocorticoid-inducible kinase 1 (pSGK1) protein expression following 24 h of systemic 5% dextrose in water (sD5W) + renal interstitial (RI) D5W (open bar, group 1), systemic angiotensin II (sANG II) + RI scrambled (SCR) siRNA (solid bar, group 3), and sANG II + RI ghrelin receptor (GR) siRNA (shaded bar, group 4) infusions. B: Western blot analysis of kidney total SGK1 protein expression in response to the same treatments in A. C: Western blot analysis of kidney pSGK1 protein expression 48 h after RI D5W (open bar) and RI GR siRNA (solid bar) infusions. D: Western blot analysis of kidney total SGK1 protein expression in response to the same treatments in C. All blots are normalized to β-tubulin. Data represent means ± SE. **P < 0.01 from sD5W + RI D5W and sANG II + RI GR siRNA treatments.

