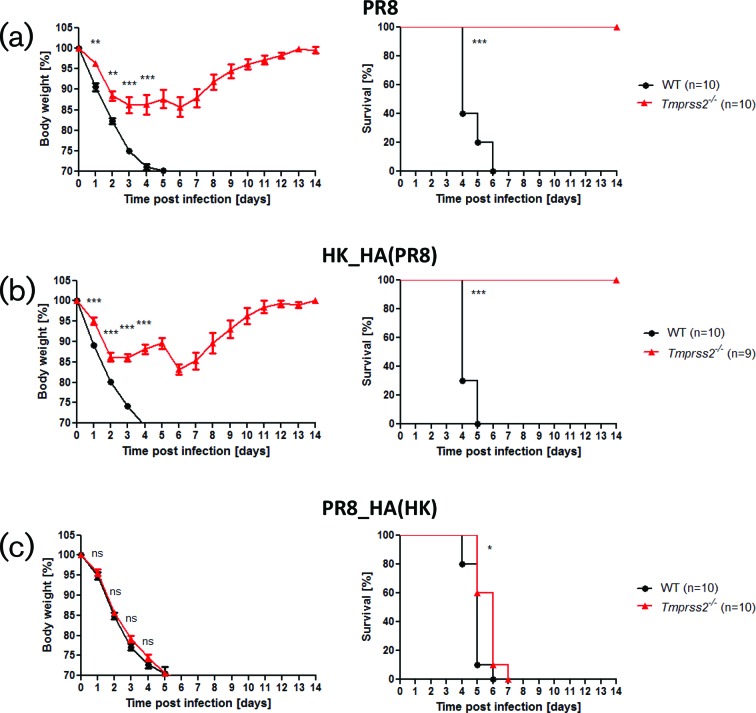
Fig. 2.
HA determines resistance phenotype in Tmprss2−/− mice. Female WT and Tmprss2−/− mice (8–12 weeks old) were infected intranasally with 2×10⁵ f.f.u. of (a) PR8 (H1N1), (b) HK_HA(PR8) (H1N2) or (c) PR8_HA(HK) (H3N1) and body weight was monitored for 14 days p.i. Left: mean body weight in percent of starting weight ±1 SEM. Right: survival graphs. Statistics for body weight loss were performed only for groups in which more than 50 % of infected mice were still alive. Significances were calculated using repeated measures ANOVA followed by a pair-wise t-test with Benjamini–Hochberg correction for multiple testing. Statistics for survival curves were calculated with the log rank test. Stars indicate adjusted P-values (*P<0.05; **P<0.01; ***P<0.001); ns: non-significant. In addition to mice that were found dead, animals with a body weight loss of more than 30 % of the starting body weight were euthanized and recorded as dead.

