Fig. 3.
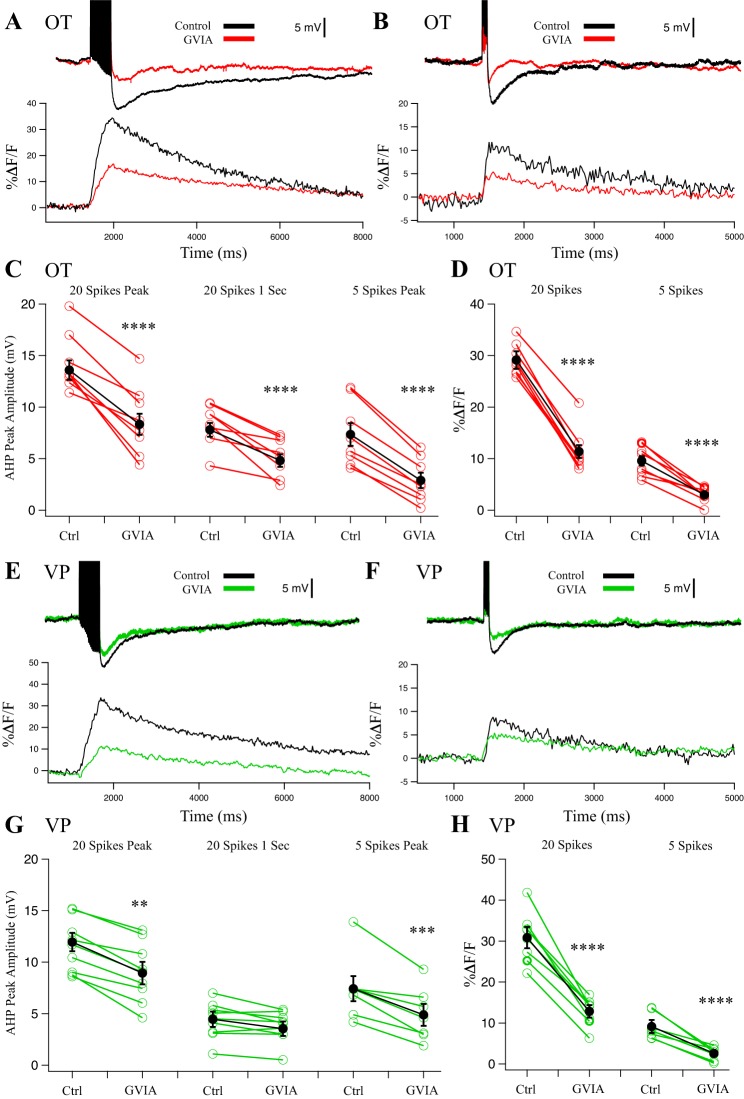
Effect of N-type blocker 1 µM conotoxin GVIA (CnTx GVIA) on afterhyperpolarizations (AHPs) and corresponding Ca2+ transients in oxytocin (OT) (n = 8) (A–D) and vasopressin (VP) (n = 7) (E–H) neurons. A: example AHP after a 20-Hz, 20-spike train from an OT neuron treated with CnTx GVIA and its corresponding somatic Ca2+ signal. B: example AHP after a 20-Hz, 5-spike train from an OT neuron treated with CnTx GVIA and its corresponding somatic Ca2+ signal. C: summary data for OT neuron AHP measurements at the 20-spike peak (medium and slow AHP, mAHP + sAHP; ****P < 0.0001), at 1 s after the train (sAHP; ****P < 0.0001), and 5-spike AHPs at the peak amplitude (mAHP; ****P < 0.0001). Red points are individual cells, and black points are group averages. D: summary data for OT neuron Ca2+ transients during AHP stimulation. CnTx GVIA significantly reduced peak %ΔF/F in 20-spike AHPs (****P < 0.0001) and reduced %ΔF/F in 5-spike AHPs (****P < 0.0001). E: example AHP after a 20-Hz, 20-spike train from a VP neuron treated with CnTx GVIA and its corresponding somatic Ca2+ signal. F: example AHP after a 20-Hz, 5-spike train from a VP neuron treated with CnTx GVIA and its corresponding somatic Ca2+ signal. G: summary data for VP neuron AHP measurements at the 20-spike peak amplitude (mAHP + sAHP; **P < 0.01), at 1 s after the train (sAHP; P > 0.05), and 5-spike AHPs at the peak amplitude (mAHP; ***P < 0.001). Green points are individual cells, and black points are group averages. H: CnTx GVIA significantly reduced peak %ΔF/F in 20-spike AHPs (paired t-test; ****P < 0.0001) and 5-spike AHPs (****P < 0.0001). All data were evaluated with a 2-way repeated-measures ANOVA.

