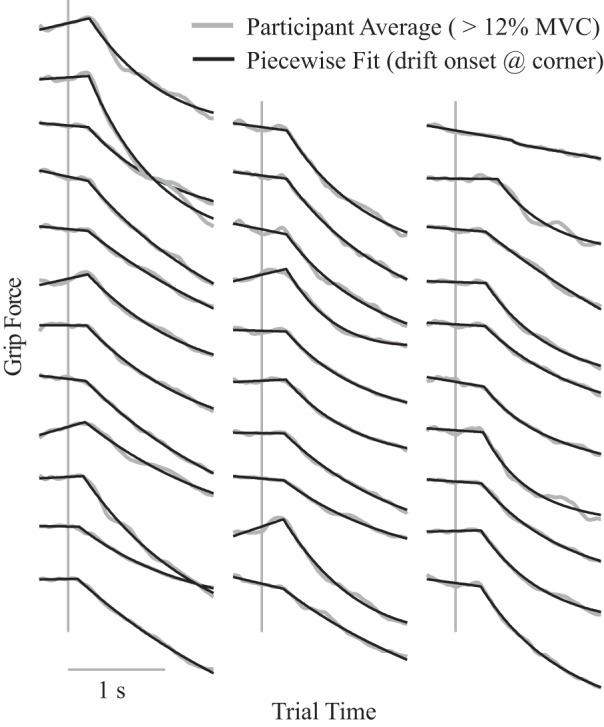
Fig. 2.

Slacking onset calculation. Each curve represents 1 participant’s difference in average force profile between error-clamp and control trials (averaged across the 5 highest force levels). The piecewise function in Eq. 1 was fit to each participant’s profile, and the onset of slacking was determined as the corner point of the piecewise function (t0 in Eq. 1). Participants are sorted with fastest onset at the bottom left and progressively slower onsets moving up each column and then proceeding to the right. Vertical lines represent the onset of the error-clamp, and the fit was performed over the range shown from 0.3 s before to 1.5 s after this onset. Data from the 2 participants with the slowest onsets (top right) appear to have confounding features that interfered with this method, and their slacking onsets were likely faster in reality. MVC, maximum voluntary contraction.
