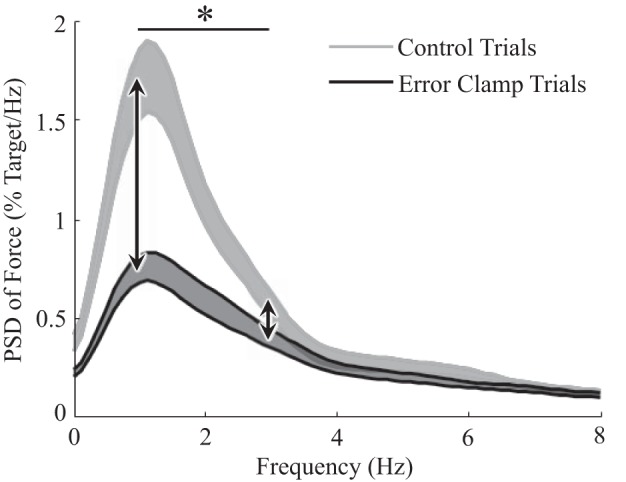
Fig. 7.

Power spectral density (PSD) of detrended grip force. PSDs were computed for both error-clamp and control trials and used to derive a 95% confidence band of the average PSD across participants (both hands included) for each condition. PSDs were based on detrended force profiles (hence the minimal power at 0 Hz) and normalized relative to target force level. Bands represent 95% confidence intervals of the mean power at each frequency. There was a significantly greater increase in power from error-clamp to control trials at 1 Hz than at 3 Hz (asterisk), implying that the increase in force variation from error-clamp to control trials was caused by heightened visually guided feedback correction.
