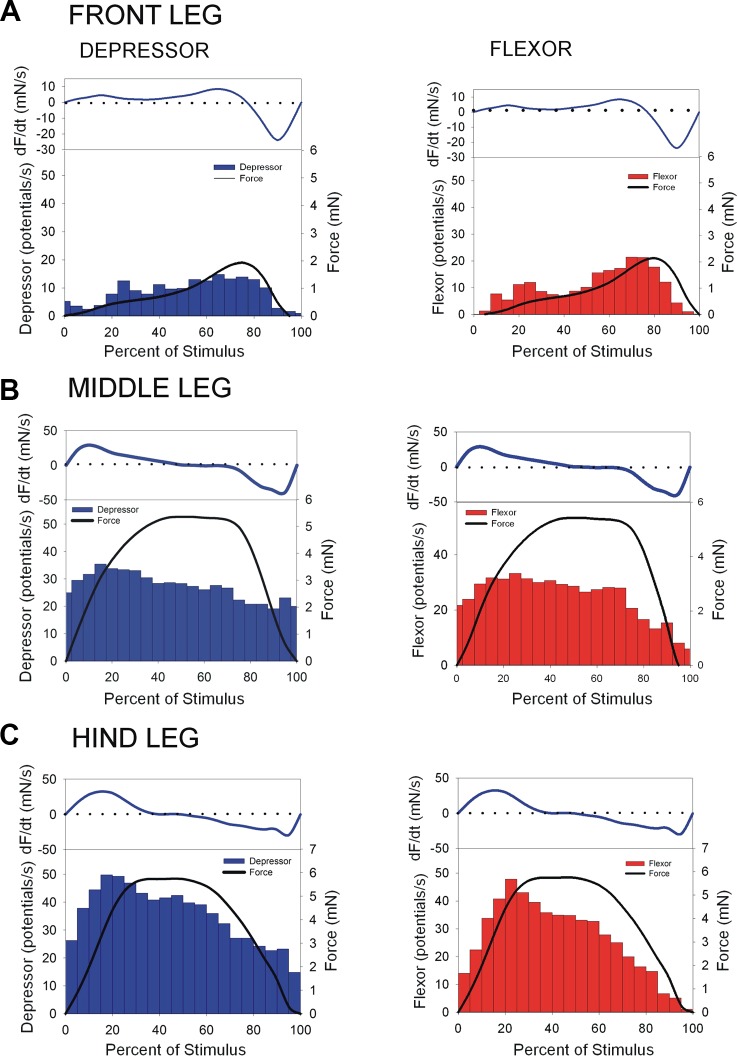
Fig. 6.
Muscle activation depends on force amplitude and rate (dF/dt). These graphs show the mean responses of depressor (in blue) and flexor muscles (in red) to application of forces using coxotrochanteral (CTr) joint torque waveforms in front (A), middle (B), and hindlegs (C). Plots of the force magnitude are overlaid, whereas the mean rates of change of force (dF/dt) are plotted above the histograms. Histograms of muscle activities are set to the same scale. A: front legs. CTr torque increased gradually (positive values of dF/dt) and then rapidly declined. Activation of both the depressor and flexor muscles was sustained and generally accelerated throughout the period of force application. B: middle legs. CTr torque increased during the 1st half of the stimulus to a much higher level than in the front legs and then declined (beginning at ~80% of the waveform). dF/dt remained positive through the period of force increase. Firing in both the depressor and flexor was sustained and only gradually decreased when the force declined. C: hindlegs. CTr torques showed the largest initial rate of increase (dF/dt) and had the largest magnitude in the hindlegs. Forces reached a brief plateau (approximately 40–60%, 0 level in dF/dt) and then declined, decreasing more rapidly toward the end of the stimulus. Firing in both the depressor and flexor increased throughout the rising phase and was sustained, only gradually declining in the period of force decrease. Thus responses to torque stimuli were sustained and reflected both the magnitude and rate of change of the applied forces.

