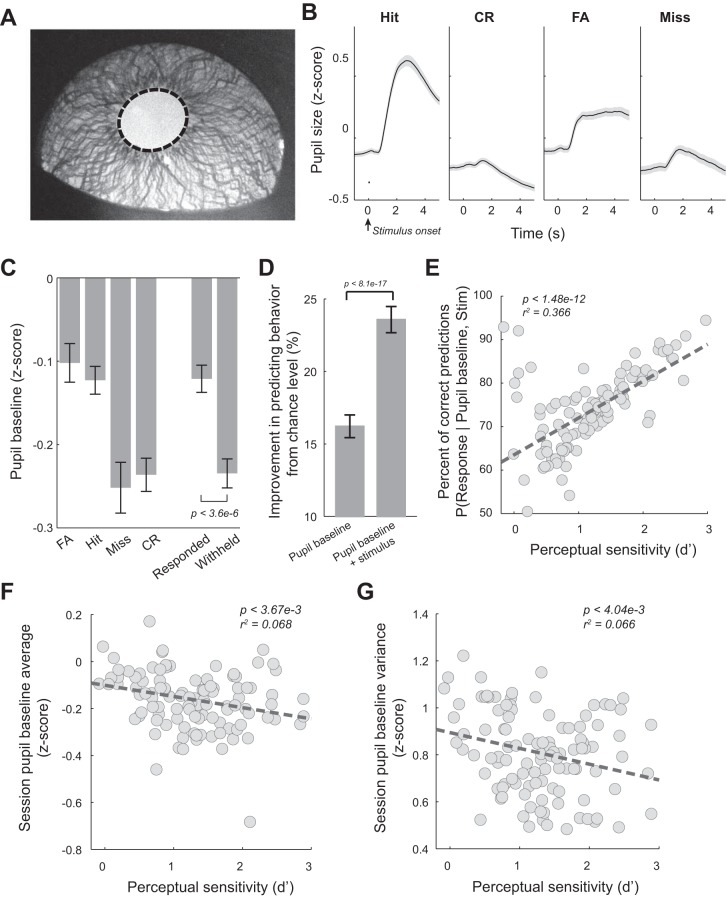
Fig. 2.
Pupil dynamics during the tactile discrimination task. A: example pupil image with overlaid pupil contour (dashed). B: average pupil dynamics around stimulus presentation for the 4 behavioral outcomes across all sessions of the 5 animals. C: pupil baselines for the 4 behavioral outcomes averaged across sessions. D: prestimulus pupil size was predictive of behavior. E: percentage of correct prediction of behavior based on pupil baseline and stimulus identity was correlated with perceptual performance. F: pupil baseline average was negatively correlated with perceptual performance. G: within-session pupil baseline variance was negatively correlated with perceptual performance. Error bars and shaded areas indicate SE. CR, correct rejection; FA, false alarm.

