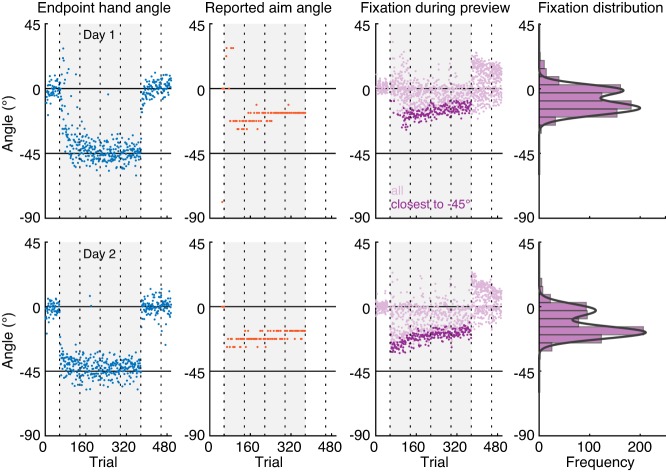
Fig. 3.
Raw data and experimental approach of classifying participants. Raw end point hand angles (blue), reported aim angles (orange) and fixation angles (purple) during the 2-s target preview period in no report trials of a representative participant in the intermittent report Experiment on day 1 (top) and day 2 (bottom). The gray background indicates when a 45° rotation was applied to the cursor feedback. Vertical dotted lines indicate the timing of 30 s breaks during the experiment. The darker purple dots show, for each trial, the selected fixation angle closest to the hand target, used to compute the group average aimpoint fixation angle. Rightmost column: histogram of all fixation angles in the rotation block. This participant was classified as an aimpoint fixator because their gaze distribution was well fit by a mixture of 2 Gaussian curves.

