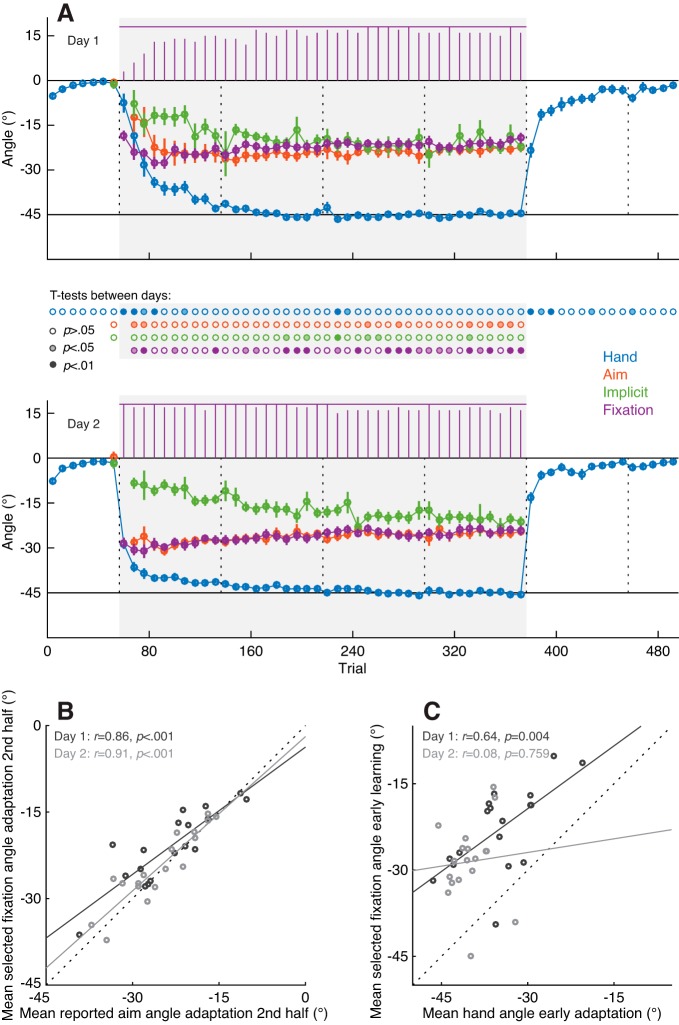
Fig. 4.
Results intermittent report experiment. A: end point hand angles (blue), reported aim angles (orange), implicit angles (green), and selected fixation angles (purple) on day 1 (top) and day 2 (bottom), averaged across aimpoint fixators (n = 18) in experiment 1. Each data point represents the average of a set of 8 trials, with error bars showing ± 1 SE across subjects. Purple bars at the top of each graph depict the number of participants contributing to the average selected fixation angle in each trial set. The gray background indicates when the 45° rotation was applied to the cursor feedback. Vertical dotted lines indicate the timing of 30-s breaks during the experiment. The rows of dots in between the top and bottom graphs show the results of uncorrected paired t-tests between each of the data points on days 1 and 2, with the color saturation indicating the significance level. B: relation between the reported aim angle and the selected fixation angle, averaged across the 2nd half of the rotation block of days 1 and 2. Dashed line indicates the unity line. C: relation between hand angle and selected fixation angle during early adaptation (trial sets 2–10 of the rotation block). R and P values in B and C show Pearson’s correlation coefficient and its significance value, respectively.

