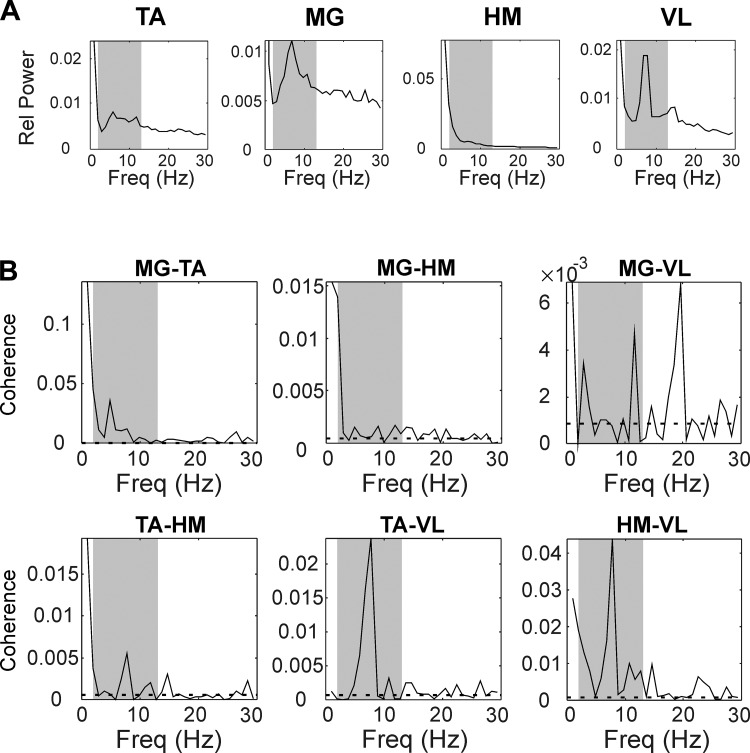
Fig. 2.
Results from a single subject, classified as American Spinal Cord Injury Association Impairment B. A: power spectra for the 4 recorded muscles, expressed as relative power (i.e., power divided by sum of power from 0 to 500 Hz). B: intermuscular coherence spectra for all 6 muscle pairs. Dashed horizontal lines represent significance limit (P < 0.05). In A and B, gray-shaded areas show frequency band at 2–13 Hz. TA, tibialis anterior; MG, right medial gastrocnemius; HM, hamstrings; VL, vastus lateralis; Freq, frequency.

