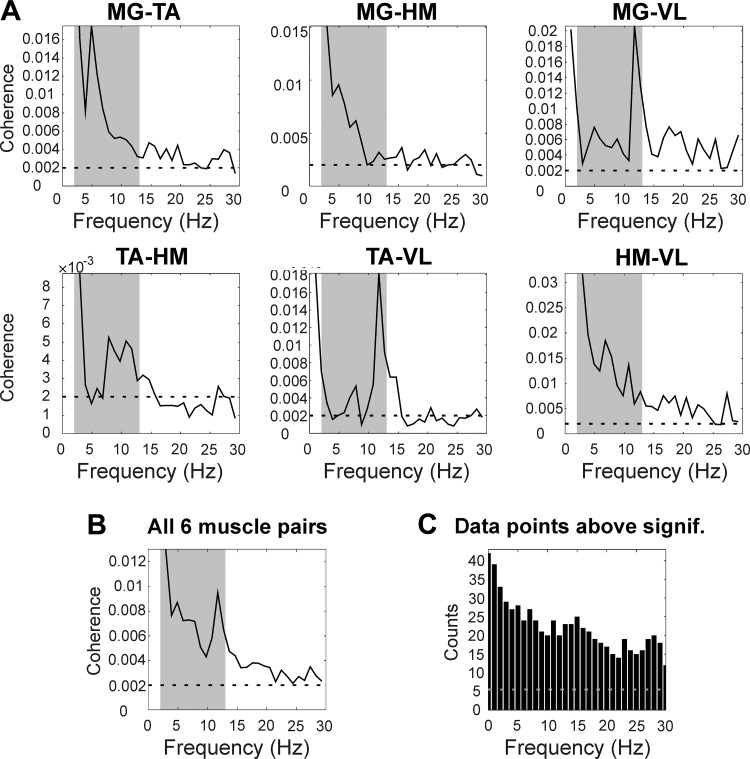
Fig. 3.
Average results. A: average coherence results from 7 spinal cord injury patients for all 6 muscle pairs. B: average coherence across 6 muscle pairs and 7 subjects. C: histogram showing the number of coherence measures above the significance limit summed over all 7 subjects and 6 muscle pairs. In A and B, gray-shaded areas show frequency band at 2–13 Hz. In A–C, dashed horizontal lines represent significance limit (P < 0.05).

