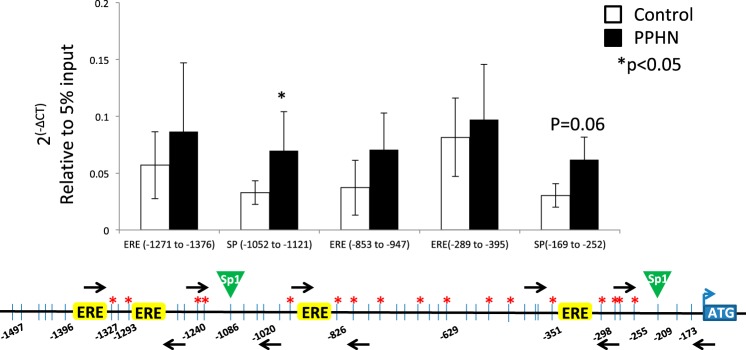
Fig. 8.
ChIP analysis for the occupancy of H3K9me3 around 2 sp1 binding sites and 3 ERE half-sites in eNOS promoter in controls (white bars) and PPHN (black bars). Black arrows on the schematic representation of eNOS promoter are the locations of primer sets designed. Data presented as 2(-∆CT) relative to 5% input. n = 6, *P < 0.05 from control.

