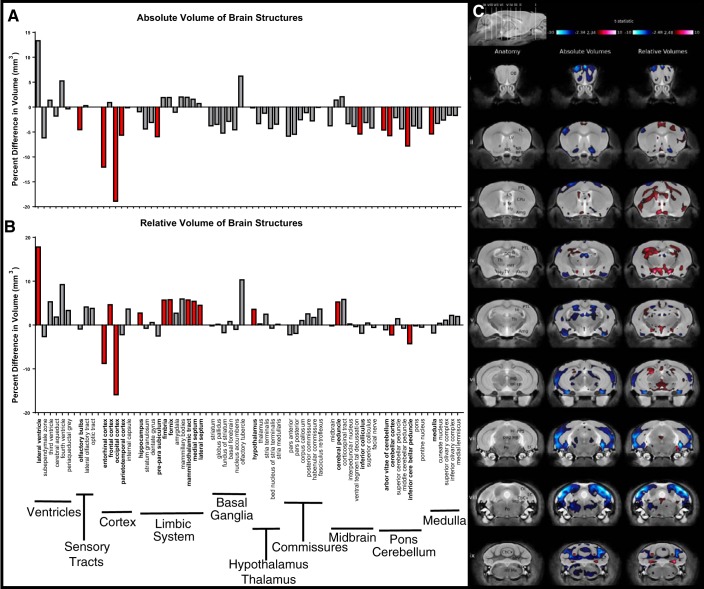
Fig. 6.
Brain structure volumes in Pgf−/− mice. MR structural analysis of mice that underwent behavioral testing (n = 8 males and females of each genotype with 1 Pgf−/− male excluded for poor image quality) revealed significant differences in the absolute volume of 10/62 brain structures between the Pgf+/+ and Pgf−/− mice (A). The difference in relative volume was significant in 14/62 areas with 4 areas smaller and 10 areas larger in the Pgf−/− mice (B). Graphs show percent difference with significance indicated by filled red bars. Voxel-wise comparison revealed size differences in widespread areas of the Pgf−/− brain seen in coronal sections (i–ix) of the MR scan (C). Significantly smaller (blue) absolute volume is complimented by significantly larger (red) relative volumes in other areas. Structures are identified as: abv, arbor vita of cerebellum; Amg, amygdala; BFB, basal forebrain; CbCx, cerebellar cortex; ml, corpus callosum; cp, cerebral peduncle; CPu, caudate/putamen; DG, dentate gyrus; EC, entorhinal cortex; fi, fimbria; FL, frontal lobe; fx, fornix; Hi, hippocampus; Hy, hypothalamus; icp, inferior cerebellar peduncle; LS, lateral septum; LV, lateral ventricle; MB, midbrain; mtt, mammillothalamic tract; Me, medulla, ml, medial lemniscus; MS, medial septum; NA, nucleus accumbens; OB, olfactory bulb; OL, occipital lobe; pag, periaqueductal gray matter; Po, pons; PPS, pre-parasubiculum; PTL, parietotemporal lobe; sc, superior colliculus; scp, superior cerebellar peduncle; sm, stria medullaris; Th, thalamus; TV, third ventricle. Data were analyzed with a false discovery rate of 0.1 for multiple comparisons.

