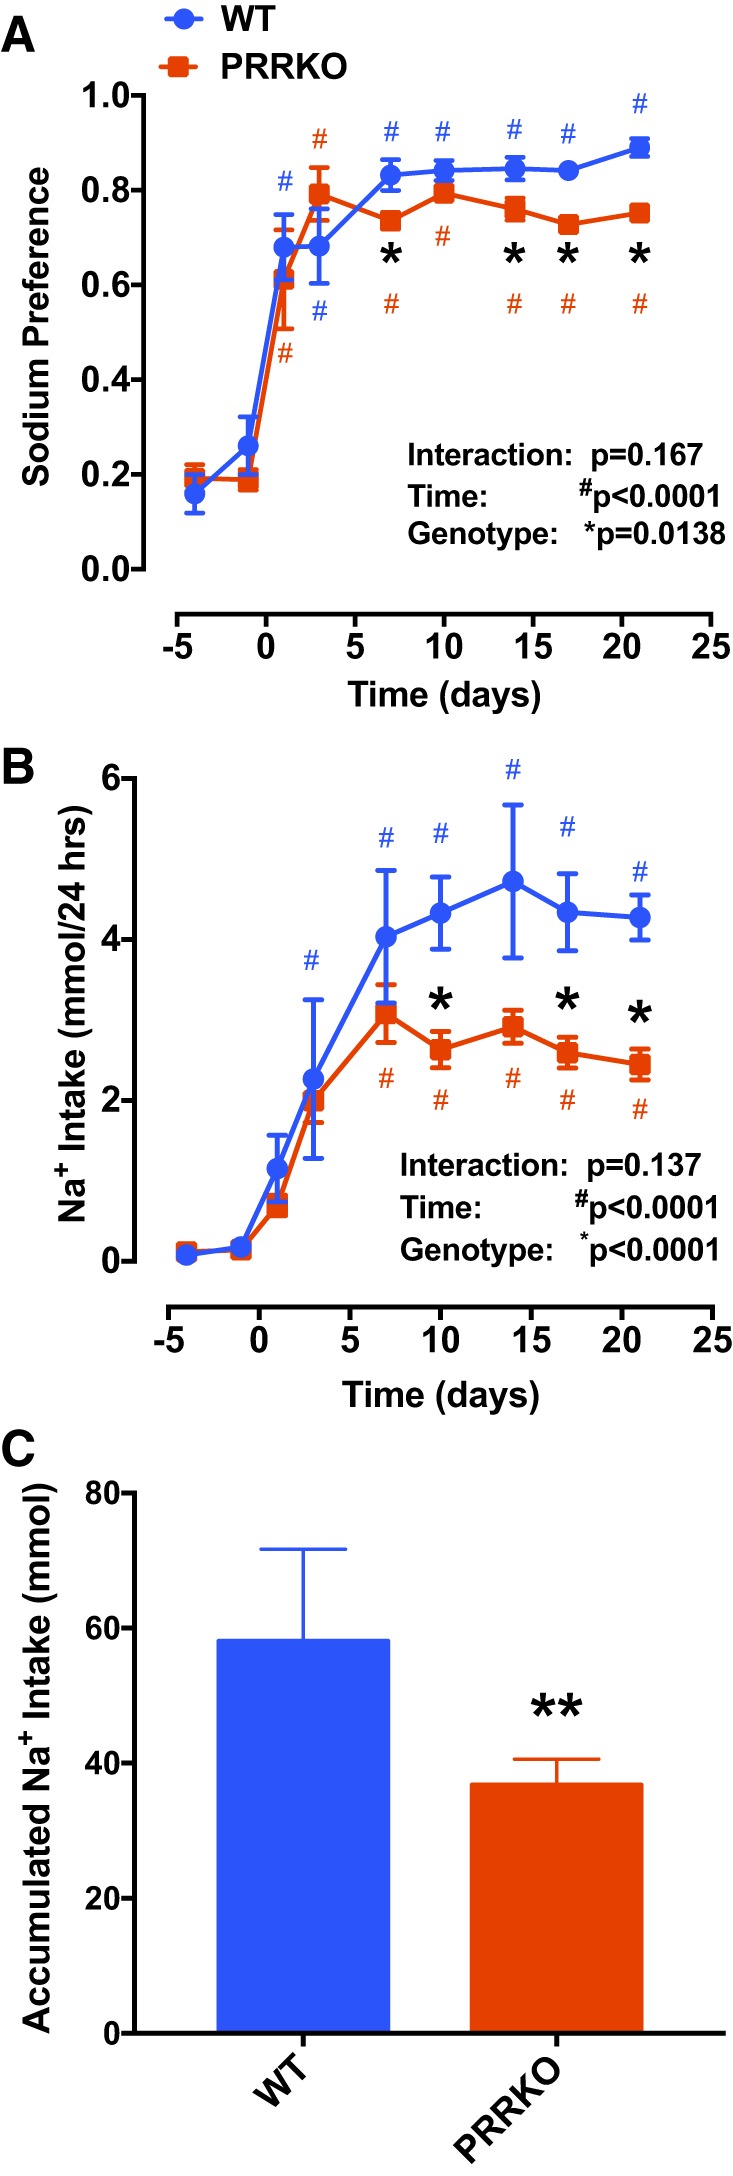
Fig. 4.

Reduction in sodium intake in neuron-specific PRRKO mice during DOCA treatment. A: sodium preference, calculated as the ratio of saline intake volume to total fluid intake volume. B: daily sodium intake. C: cumulative sodium intake. *P < 0.05 vs. WT at the same time point; **P < 0.001 vs. WT at the end of treatment; #P < 0.05 vs. day 0 in mice with the same genotype; Student’s t-test or two-way ANOVA (n = 5/group).
