
Fig. 8.
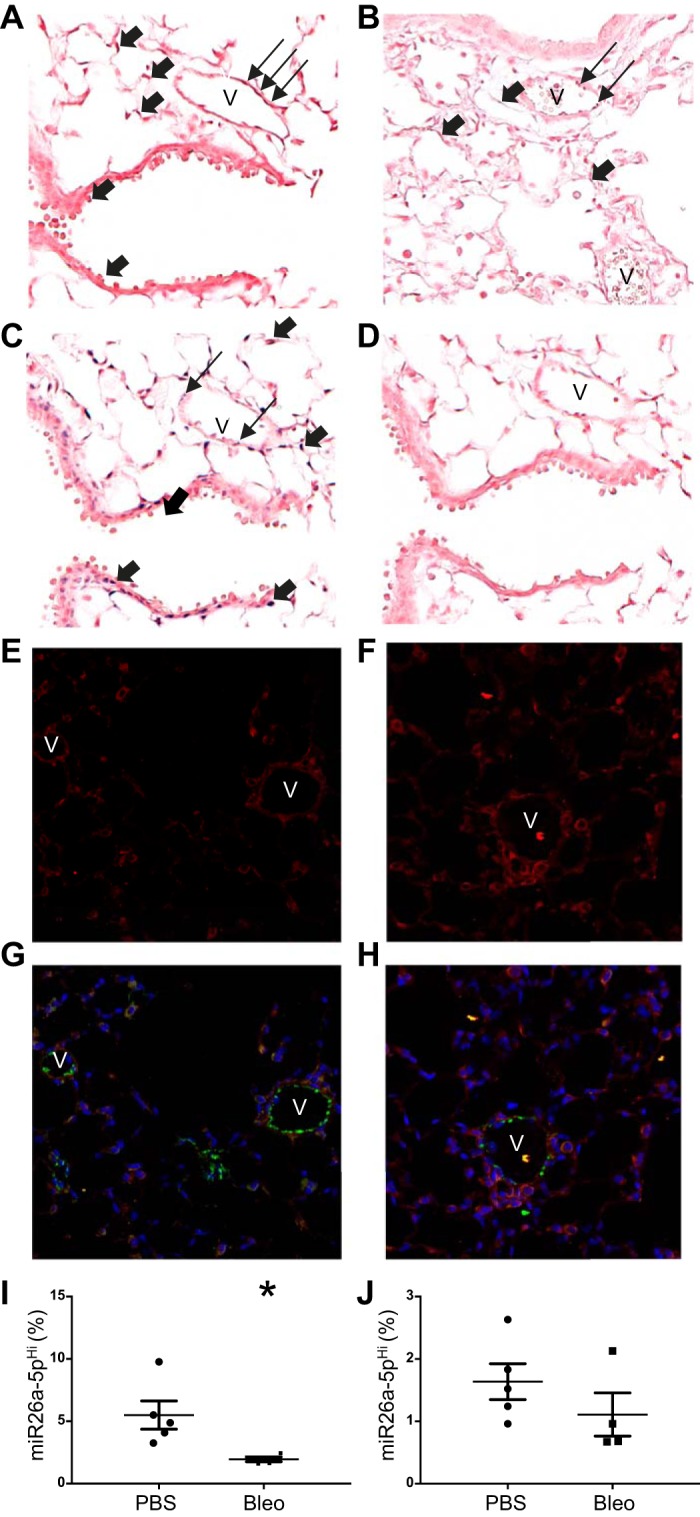
Localization of lung miR-26a and EphA2. Mice were treated with 100 µl of PBS or 0.1 U of bleomycin in 100 µl of PBS, and lungs were harvested 7 days after treatment. In situ hybridization (ISH) with dark blue staining for miR-26a after PBS (A) and bleomycin (B) treatment. ISH with dark blue staining for U6 (C) and negative control miRNA (D) after PBS treatment. Immunofluorescence staining for EphA2 (red), VWF (green), and DAPI (blue) after PBS (E and G) and bleomycin (F and H) treatment. Percentage of lung endothelial (I) and epithelial (J) cells expressing miR-26a. Images shown at ×20 magnification. V, vessel. Thick arrows denote positive staining in nonendothelial cells, whereas the thin arrows denote positive staining in endothelial cells. Data displayed as means ± SE; n = 4 or 5. *P < 0.05 compared with PBS as determined by unpaired t-test. U6, small nuclear RNA U6; 18S, ribosomal protein 18S.