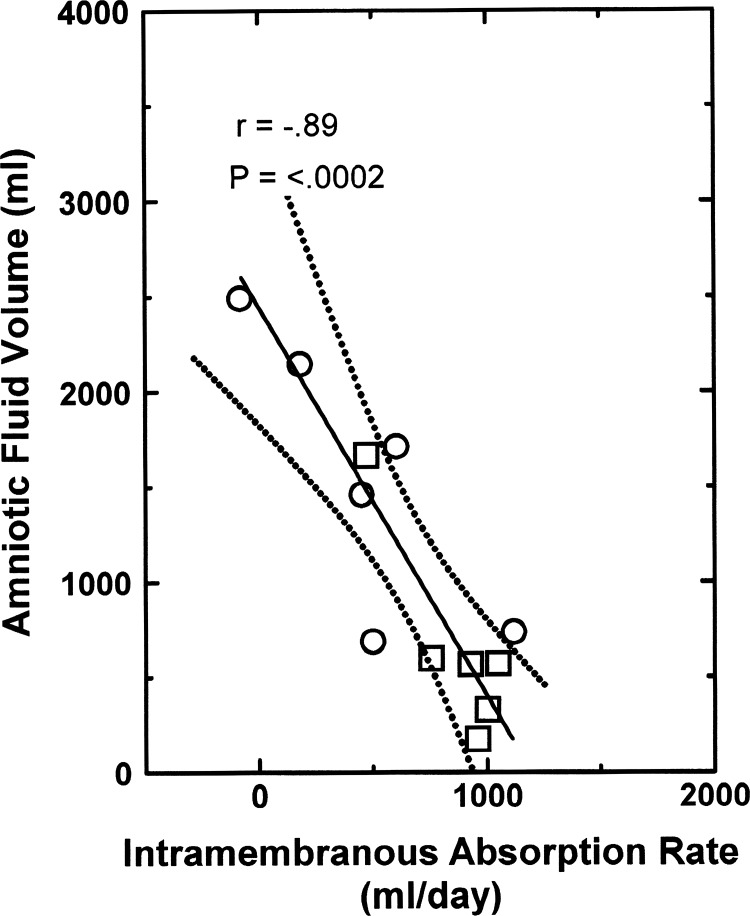
Fig. 2.
Normal amniotic fluid volume function curve: amniotic fluid volume as a function of intramembranous absorption rate in 6 ovine fetuses under control conditions (☐) and in the same fetuses when their urine was isovolumically replaced with lactated Ringer solution (○). Data from Ref. 9. Solid line is the regression line, and dotted lines show the 95% confidence interval.

