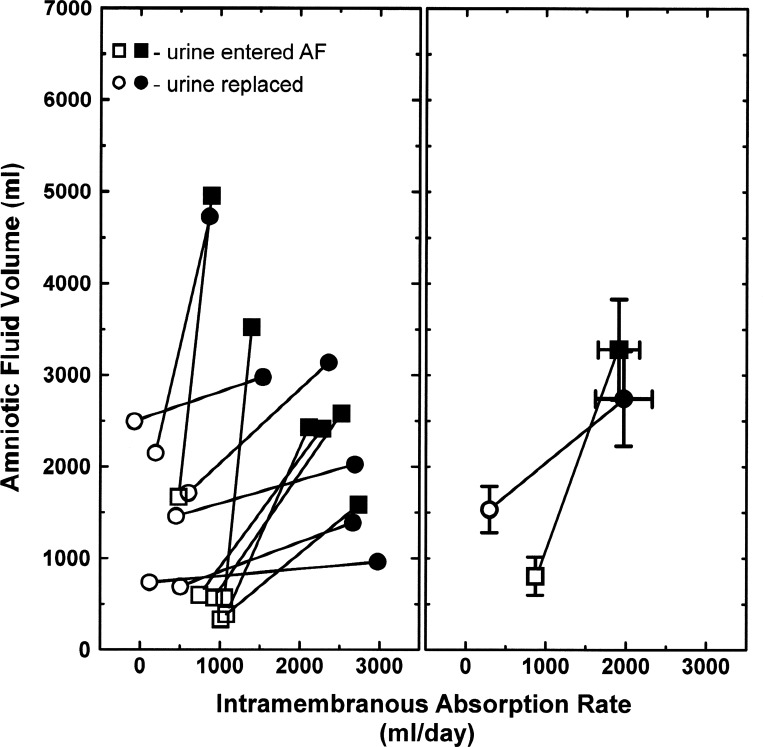
Fig. 3.
Amnioinfusion function curves. Amniotic fluid volume and intramembranous absorption rate before (open symbols) and after (filled symbols) intra-amniotic infusion of 4 l/2 days of lactated Ringer solution in individual ovine fetuses (left) and their average (±SE) responses (right). Fetal urine either entered the amniotic fluid (AF) or was isovolumically replaced with lactated Ringer solution. Data from Refs. 9 and 24.

