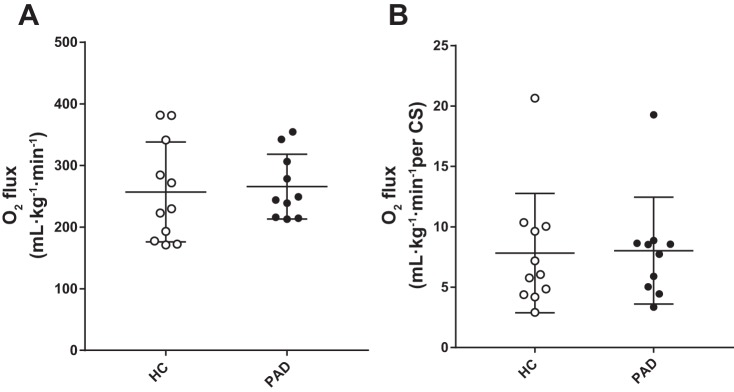
Fig. 8.
Comparison of state 3 and complex I and II mitochondrial respiration rate assessed in vitro in healthy control (HC) subjects and patients with peripheral artery disease (PAD). Individual state 3 and complex I and II mitochondrial respiration rate (O2 flux) data are expressed as both per muscle tissue wet weight (m·kg−1·min−1; A) and normalized to citrate synthase activity (B). Values are expressed as means ± SE.

