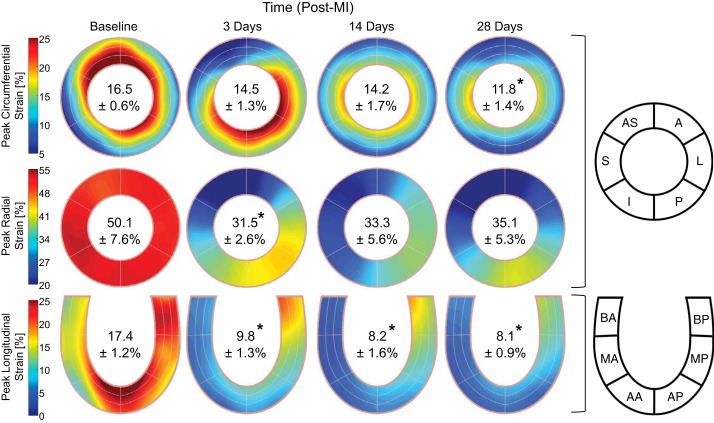
Fig. 3.
Peak myocardial strain. Spatial maps of the absolute value of peak myocardial segmental strain in the circumferential (top), radial (middle), and longitudinal (bottom) directions at baseline and at 3, 14, and 28 days post-myocardial infarction (post-MI) are shown. Inscribed values indicate the peak global strain reported as mean absolute values ± SE. *P < 0.05 vs. the respective baseline value (n = 8, one-way ANOVA with post hoc least-significant-difference comparisons). AS, anterior septum; S, septal; I, inferior; P, posterior; L, lateral; A, anterior; BA, basal anterior septum; MA, mid anterior septum; AA, apical anterior septum; BP, basal posterior; MP, mid posterior; AP, apical posterior.

