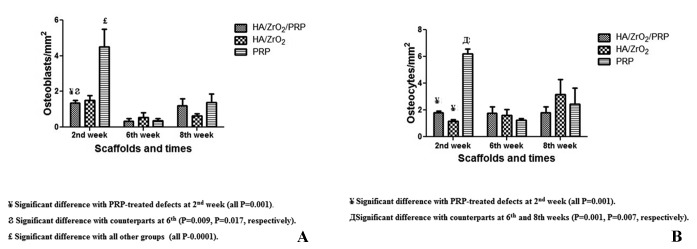
Figure9.
Comparison of the number of osteoblasts (A) and osteocytes (B) between the HA/ZrO2/PRP-treated defects and the HA/ZrO2 and PRP-treated defects.
¥ Significant difference with the PRP-treated defects at the second week (all Ps=0.001).
Ϩ Significant difference with the counterparts at the sixth week (P=0.009 and P=0.017, respectively).
£ Significant difference with all the other groups (all Ps=0.0001).
Д Significant difference with the counterparts at the sixth and eighth weeks (P=0.001 and P=0.007, respectively).

