
Figure 5.
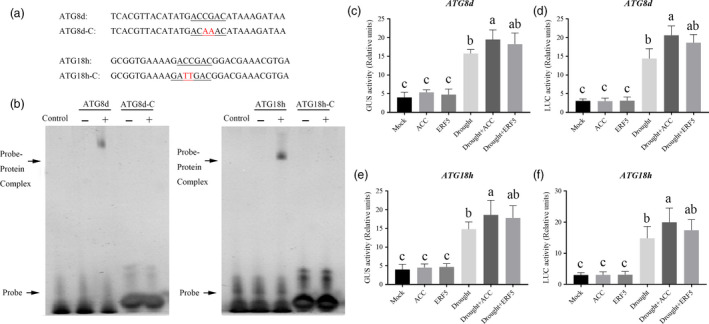
Analysis of ATG8d and ATG18h promoters. (a) Oligonucleotide used in the electrophoretic mobility shift assays (EMSA). The WT and mutated DRE sequences are underlined. The mutated bases were indicated in red. (b) EMSA showing ERF5 bound to the DRE sequences of the ATG8d or ATG18h promoters. Recombinant ERF5 was purified from E. coli cells and used for DNA binding assays. His was included as the negative control. (c‐f) Relative GUS and LUC activity of ATG8d (c,d) and ATG18h (e,f) promoters were detected under control or drought condition by different treatments. N. benthamiana plants were treated with 0.1 μm ACC for 12 h, and then, the leaves were transiently transformed with different constructs. For drought treatment, the N. benthamiana plants were first treated with 0.1 μm ACC for 12 h and then the leaves were transiently transformed with different constructs, after another 12 h, they were treated with 16% PEG6000 for 60 h. The CaMV 35S promoter was fused to GUS or LUC as a control for variation in transformation rate. Bars represent mean and standard deviation of values obtained from three biological repeats. Means with the same letter did not significantly differ at P < 0.05 according to the Duncan multiple range tests.