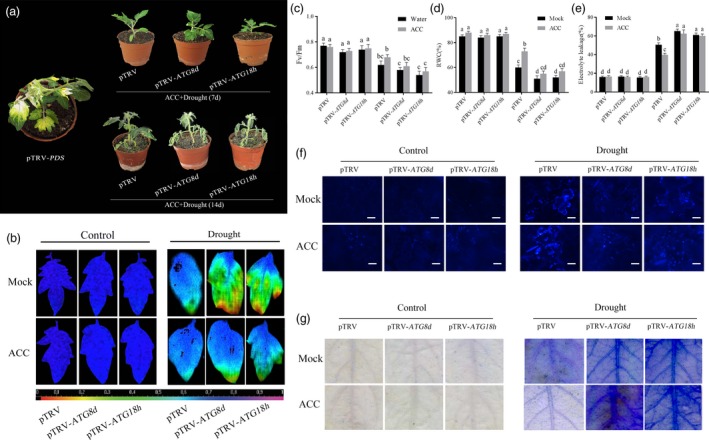
Figure 6.

Reduced tomato drought tolerance in TRV‐ATG8d and TRV‐ATG18h plants. TRV‐SlPDS was used as positive control, and TRV‐mock was used as negative control. (a) Phenotypes of ACC‐induced drought tolerance in TRV‐ATG8d and TRV‐ATG18h plants (7d: upper; 14d: lower). (b, c) Changes of the maximum PSII quantum yield (F v/F m) in ACC‐pretreated ATG8d‐ and ATG18h‐silenced plants in the 14th day under drought conditions. (d, e) Detection of RWC and EL in ACC‐pretreated TRV‐ATG8d and TRV‐ATG18h plants under different condition. (d) MDC‐stained autophagosomes of different treatment groups in the leaves of TRV, TRV‐ATG8d, and TRV‐ATG18h plants. Five‐week‐old plants were exposed to dehydration by withholding water, and the leaves were MDC‐stained and visualized in the 7th day by fluorescence microscopy. MDC‐labelled structures are shown as blue signals. Bars: 25 μm. (e) Trypan blue staining showing cell death in the leaves of TRV, TRV‐ATG8d and TRV‐ATG18h plants. Means with the same letter did not significantly differ at P < 0.05 according to Duncan multiple range tests. Three independent experiments were performed with similar results.
