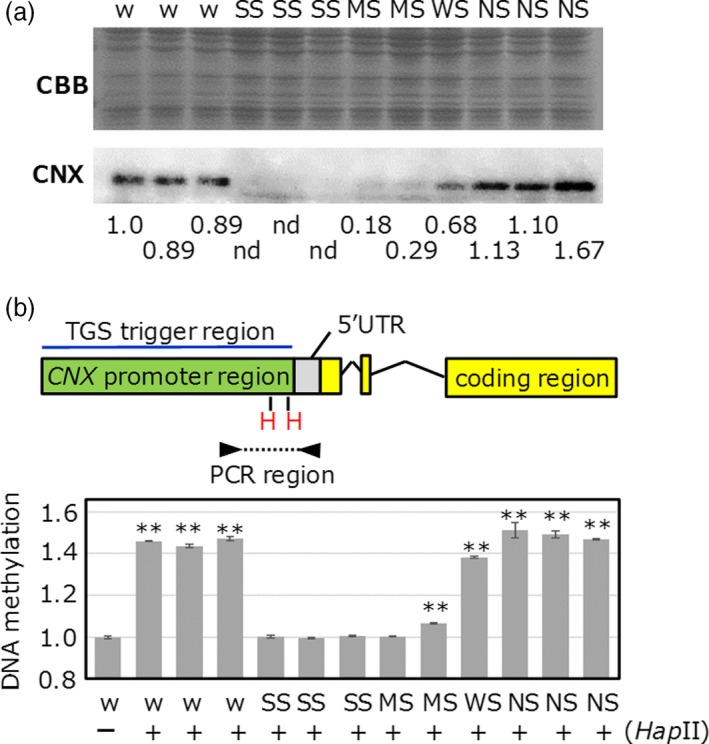
Figure 2.

The relationship between the DNA cytosine methylation and TGS levels in CNX TGS lines. (a) Screening of various TGS lines. Wild type (w), strong TGS (SS), moderate TGS (MS), weak TGS (WS) and no TGS (NS) lines were screened. (b) Quantitative PCR after digestion of genomic DNA with methylation‐sensitive restriction enzyme Hap II (H) was shown as a bar graph. There are two Hap II sites between the primer sets. After overnight digestion with restriction enzymes, real‐time PCR amplification was performed. All PCR products were derived from endogenous genomic DNA but not from vector. (‐) shows undigested DNA sample; (+) shows digested DNA sample. Asterisks show statistically significant (*P < 0.05, **P < 0.01) differences (ΔCt values) relative to wt without Hap II digestion.
