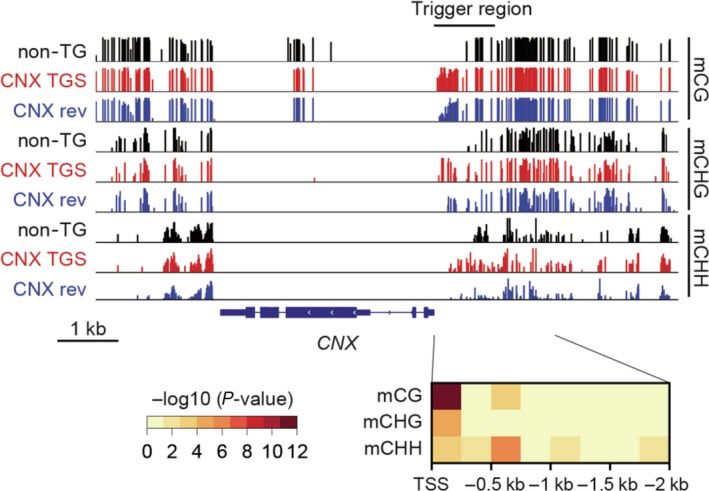
Figure 6.

Methylation levels in the CNX promoter region in a line with preserved TGS and a line with TGS lost after the removal of the trigger gene. Top panel shows a snapshot of the methylation levels in each context around the CNX genes of control nontransgenic (non‐TG), CNX TGS and CNX revertant (CNX rev) lines. Methylation level at each site is indicated by tick height. The bottom panel shows P‐values (Fisher's exact test) for differential methylation in each context between CNX TGS and CNX rev.
