
Figure 7.
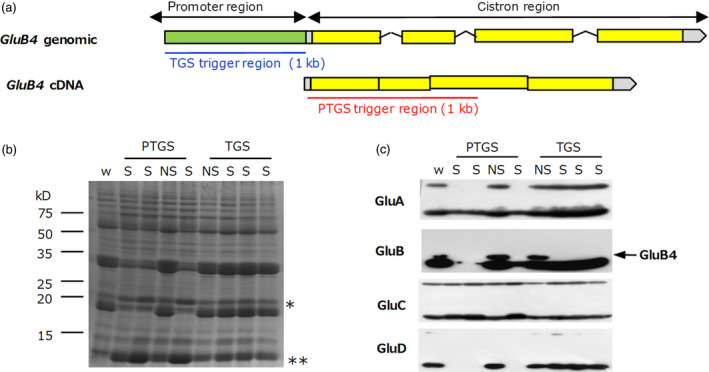
Comparison of PTGS and TGS specificity towards a target gene. (a) Structure of the GluB4 gene and its transcript (cDNA). Target regions used to induce GluB4 silencing are underlined (blue, TGS; red, PTGS). (b) Coomassie Brilliant Blue‐stained SDS‐PAGE gel showing seed proteins derived from PTGS and TGS lines (four seeds per line were analysed). w, wild type; S, silenced; NS, not silenced. * globulin; ** prolamins. (c) Immunoblot analysis of the same samples as in panel (b). Anti‐GluA antibody reacts with GluA1 and GluA2; anti‐GluB antibody reacts with GluB1, GluB2 and GluB4; anti‐GluC and GluD antibodies are specific. Upper bands, glutelin precursors; lower bands, glutelin acidic subunit.